Preparing for life without Edgesight with ExtraHop
So, the rumors have been swirling and I think we have all come to the quiet realization that Edgesight is going to be coming to an end. At least the Edgesight we know and Love/Hate.
For those of us who have continued with this labor of love trying squeeze every possible metric we could out of Edgesight we are likely going to have to come to grips with the fact that the next generation of Edgesight will not have the same level of metrics we have today. While we all await the next version of HDX Edgesight with we can almost be certain that the data model and all of the custom queries we have written over the last 3 years will not be the same.
Let’s be honest, Edgesight has been a nice concept but there have been extensive problematic issues with the agent both from a CPU standpoint (firebird service taking up 90% CPU) and keeping the versions consistent. The real-time monitoring requires elevated permissions of the person looking into the server forcing you to grant your service desk higher permissions than many engineers are comfortable with. I am, for the most part, a “tools”-hater. In the last 15 years I have watched millions of dollars spent on any number of tools, all of which told me that they would be the last tool I would need and all of them in my opinion where, for the most part, underwhelming. I would say that Edgesight has been tolerable to me and it has done a great job of collecting metrics but, like most tools I have worked with, it is Agent based, also it cannot log in real-time. The console was so unusable that I literally have not logged into it for the last four years. (In case you were wondering why I don’t answer emails with questions about the console).
For me, depending on an agent to tell you there is an issue is a lot like telling someone to “yell for help if you start drowning”. If a person is under water, it’s a little tough for them to yell for help. With agents, if there is an issue with the computer, whatever that is (CPU, Disk I/O, Memory) will likely impact the agent as well. The next best thing, which is what I believe Desktop Director is using, is to interrogate a system via WMI. Thanks to folks like Brandon Shell, Mark Schill and the people at Citrix who set up the Powershell SDK. This has given rise to some very useful scripting that has given us the real-time logs that we have desperately wanted. That works great for looking at a specific XenApp server but in the Citrix world where we are constantly “proving the negative” it does not provide the holistic view that Edgesight’s downstream server metrics provided.
Proving the negative:

As some of you are painfully aware, Citrix is not just a Terminal Services delivery solution. In our world, XenApp is a Web Client, a Database Client, Printing Client and a CIFS/SMB client. The performance of any of these protocols will result in a ticket resting in your queue regardless of the downstream server performance. Edgesight did a great job of providing this metric letting you know if you had a 40 second network delay getting to a DFS share or a 5000ms delay waiting for a server to respond. It wasn’t real-time but it was better than anything I had used until then.
While I loved the data that Edgesight provided, the agent was problematic to work with, I had to wait until the next day to actually look at the data, unless you ran your own queries and did your own BI integration you had, yet another, console to go to and you needed to provide higher credentials for the service desk to use the real-time console.
Hey! Wouldn’t it be great if there were a solution that would give me the metrics I need to get a holistic view of my environment? Even better, if it were agentless I wouldn’t have to worry about which .NET framework version I had; changes in my OS, the next Security patch that takes away kernel level access and just all around agent bloat from the other two dozen agents I already have on my XenApp sever. Not to mention the fact that the decoupling of GUIDs and Images thanks to PVS has caused some agents to really struggle to function in this new world of provisioned server images.
It’s early in my implementation but I think I have found one….Extrahop.
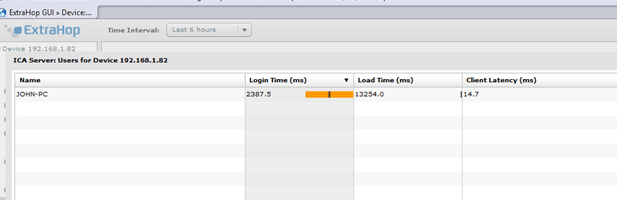
Extrahop is the brain-child of ADC pioneer Jesse Rothstein who was one of the original developers of the modern Application Delivery Controller. The way Extrahop works is that it sits on the wire and grabs pertinent data and makes it available to your engineer and, if you want, your Operations staff. Unlike wireshark, a great tool for troubleshooting; it does not force you, figuratively, to drink water from a fire hose. They have formed relationships with several vendors, gained insight into their packets and are able to discriminate between which packets are useful to you and which packets are not. I am now able to see, in real-time, without worrying about an agent, ICA Launch times and the Authentication time when a user launches an application. I can also see client latency, Virtual Channel Bytes In and Bytes Out for Printer, Audio, Mouse, Clipboard, etc.
(The Client-Name, Login time and overall Load time as well as the Latency of my Citrix Session)
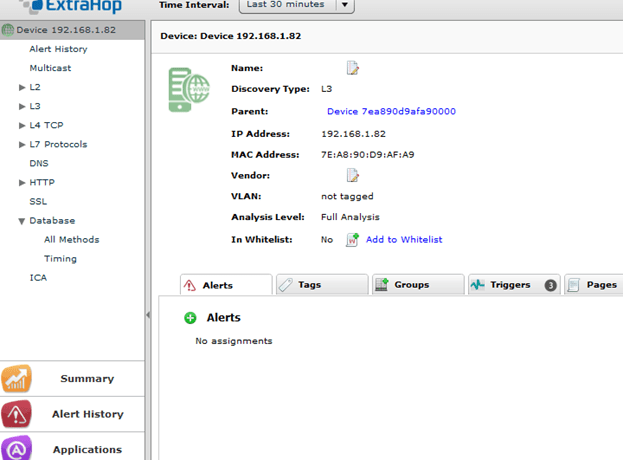
In addition to the Citrix monitoring, it helps us with “proving the negative” by providing detailed data about Database, HTTP and CIFS connections. This means that you can see, in real-time, performance metrics of the application servers that XenAPP is connecting to. If there is a specific URI that is taking 300 seconds to process, you will see it when it happens without waiting the next day for the data or having to go to edgesightunderthehood.com to see if John, David or Alain have written a custom query.
If there is a conf file that has an improper DNS entry, it will show up as a DNS Query failure. If your SQL Server is getting hammered and is sending RTOs, you will see it in real-time/near-time and be able to save yourself hours of troubleshooting.
(Below, you see the different metrics you can interrogate a XenApp server for.)
Extrahop Viewpoints:
Another advantage of Extrahop is that you can actually look at metrics from the point of view of the downstream application servers as well. This means that if you publish an IE Application and it connects to a web server that integrates with a downstream database server you can actually go to that web server you have published in your application and look at the performance of that web server and the database server. If you have been a Citrix Engineer for more than three years, you should already be used to doing the other team’s troubleshooting for them but this will make it even faster. You basically get a true, holistic view of your entire environment, even outside of XenApp, where you can find bottlenecks, flapping interfaces and tables that need indexing. If your clients are on an internal network, depending on your topology you can actually look at THEIR performance on their workstations and tell if the switch in the MDF is saturated.
Things I have noted so far looking at Extrahop Data:
- SRV Record Lookup failures
- Poorly written Database Queries
- Exessive Retransmissions
- Long login times (thus long load times)
- Slow CIFS/SMB Traffic
- Inappropriate User Behavior
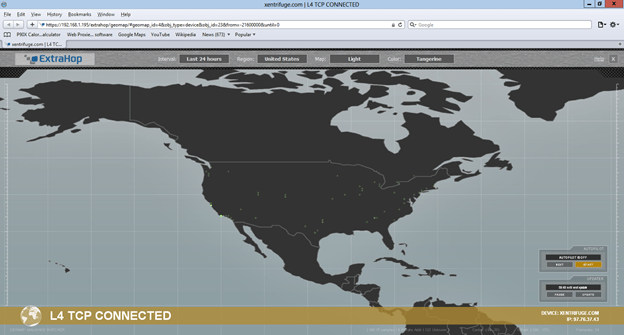
GEOCODING Packets:
Another feature I like is the geocoding of packets, this is very useful to use if you want to bind a geomap to your XenApp servers to see if there is any malware making connections to China or Russia, etc. (I have an ESUTH post on monitoring Malware with Edgesight.) Again, this gives me a real-time look at all of my TCP Connections through my firewall or I can bind it on a per-XenApp, Web Server or even PC node. The specific image below is of my ASA 5505 and took less than 15 seconds to set up (not kidding).
On the wire (Extrahop) vs. On the System (Agent):
I know most of us are “systems” guys and not so much Network guys. Because there is no agent on the system and it works on the wire, you have to approach it a little differently and you can see how you can live without an agent. Just about everything that happens in IT has to come across the wire and you already have incumbent tools to monitor CPU, Memory, Disk and Windows Events. The wire is the last “blind spot” that I have not had a great deal of visibility into from a tools perspective until I started using Extrahop. Yes there was wireshark but for archival purposes and looking at specific streams are not quite as easy. Yes, you can filter and you can “flow TCP Stream” with wireshark but it is going to give you very raw data. I even edited a TCPDUMP based powershell script to write the data to SQL Server thinking I could archive the data that way. I had 20GB of data inside of 30 minutes, with Extrahop you can actually trigger wire captures based on specific metrics and events that it sees in the flow and all of the sifting and stirring is done by Extrahop just leaving you to collect the gold nuggets.
Because it is agentless you don’t have questions like “Will Extrahop support the next edition of XenAPP?” “Will Extrahop Support Windows Server2012” “What version of the .Net Framework do I need to run Extrahop” “I am on Server Version X but my agents are on version Y”
The only question you have to answer to determine if your next generation of hardware/software will be compatible with Extrahop is “Will you have an IP Address?” If your product is going to have an IP Address, you can use Extrahop with it. Now, you have to use RFC Compliant protocols and Extrahop has to continue to develop relationships with vendors for visibility but in terms of deploying and maintaining it, you have a much simpler endeavor than other vendors. The simplicity of monitoring on the wire is going to put an end to some of the more memorable headaches I have had in my career revolving around agent compatibility.
Splunk/Syslog Integration:
So, I recently told my work colleagues that the next monitoring vendor that shows up saying I have to add yet another console I am going to say “no thanks”. While the Extrahop console is actually quite good and gives you the ability to logically collate metrics, applications and devices the way you like, it also has extensive Splunk integration. If there are specific metrics that you want sent to an external monitor, you can send them to your syslog server and integrate them into the existing syslog strategy be it Envision, KIWI Syslog Server or any other SIEM product. They have a javascript based trigger solution that allows you to tap into custom flows and cherry pick those metrics that are relevant to you. Currently, there is a very nice and extensive Splunk APP for Extrahop.
I am currently logging (in real-time) the following with Extrahop:
- DNS Failures (Few people realize how poor DNS can wreck nth-tiered environments)
- ICA OPEN Events (to get logon times and authentication times)
- HTTP User Agent Data
- HTTP Performance Data
So if this works by monitoring the wire, isn’t it the Network team’s tool?
The truth is it’s everybody’s tool, the only thing you need the network team to do is span ports for you (then log in and check out their own important metrics). You can have the DBA log in and check the performance of their queries, the Network Engineers can log in and check jitter, TCP retransmissions, RTOs and throughput, the Citrix guy can log in and check Client Latency, STA Ticket delivery times, ICA Channel throughput, Logon/Launch Times, the Security team can look for TCP Connections to China, Russia and catch people RDPing home to their home networks and the Web Team can go check which user-Agents are the most popular to determine if they need to spend more time accommodating tablets. Everybody has something they need on the wire; I sometimes fear that we tend to select our tools based on what technical pundits tell us too. In our world, from a vendor standpoint, we tend to like to put things in boxes (which is a great irony given everyone’s “think outside the box” buzz statement). We depend on thought leaders to put products in boxes and tell us which ones are leaders, visionaries, etc. I don’t blame them for providing product evaluations that way, we have demanded that. For me, Extrahop is a great APM tool but it is also a great Network Monitoring tool and has value to every branch of my IT Department. This is not a product whose value can be judged by finding its bubble in a Gartner scatter plot.
Conclusion:
I have not even scratched the surface of what this product can do. The triggers engine basically gives you the ability to write nearly any rule you want to log/report any metric you want. Yes, there are likely things you can get with an agent that you cannot get without an agent but in the last few years these agents have become a lot like a ball and chain. You basically install the appliance or import the VM, span the ports and watch the metrics come in. I have had to change my way of thinking of metrics gather from system specific to siphoning data off the wire but once you wrap your head around how it is getting the data you really get a grasp of how much more flexibility you have with this product than with other agent based solutions. The Splunk integration was the icing on the cake.
I hope to record a few videos showing how I am doing specific tasks, but please check out the links below as they have several very good live demos.
To download a trial version: (you have to register first)
http://www.extrahop.com/discovery/
Numerous webinars:
http://www.extrahop.com/resources/
Youtube Channel:
http://www.youtube.com/user/ExtraHopNetworks?feature=watch
Thanks for reading and happy holidays!
John
ICASTART, ICAEND “ICA-LIKE!!!”
In 2008 I had a conversation with Jay Tomlin asking him if he would put in an enhancement for ICA Logging on the AGEE. Basically we wanted the ability to see the external IP Addresses of our customers coming through the Access Gateway. As you are likely aware, what you get in the logs are the IP Addresses bound to the workstation and not the external IP Address that they are coming through. In the last ten years, it has become increasingly rare for an end user to actually plug their computer directly into the internet and more often, they are proxied behind a Netgear, Cisco/Linksys, and Buffalo switch. This makes reporting on where the users are coming from somewhat challenging.
Somewhere between 9.2 and 9.3 the requested enhancement was added and it included other very nice metrics as well. The two syslog events I want to talk about are ICASTART and ICAEND.
ICASTART:
The ICASTART event contains some good information in addition to the external IP. Below you see a sample of the ICASTART log.
12/09/2012:14:40:46 GMT ns 0-PPE-0 : SSLVPN ICASTART 540963 0 : Source 192.168.1.98:62362 – Destination 192.168.1.82:2598 – username:domainname mhayes:Xentrifuge – applicationName Desktop – startTime “12/09/2012:14:40:46 GMT” – connectionId 81d1
As you can see, if you are a log monger, this is a VERY nice log!! (Few can appreciate this) With the exception of the credentials everything is very easy to parse and place into those nice SQL Columns I like. If you have Splunk, parsing is even easier and you don’t have to worry about how the columns line up.
ICAEND:
The ICAEND even actually has quite a bit more information and were it not for the need to report ICA Sessions in real time, this is the only log you will need. Below is the ICAEND log.
12/09/2012:14:41:12 GMT ns 0-PPE-0 : SSLVPN ICAEND_CONNSTAT 541032 0 : Source 192.168.1.98:62362 – Destination 192.168.1.82:2598 – username:domainname mhayes:Xentrifuge – startTime “12/09/2012:14:40:46 GMT” – endTime “12/09/2012:14:41:12 GMT” – Duration 00:00:26 – Total_bytes_send 9363 – Total_bytes_recv 587588 – Total_compressedbytes_send 0 – Total_compressedbytes_recv 0 – Compression_ratio_send 0.00% – Compression_ratio_recv 0.00% – connectionId 81d16
Again, another gorgeous log that is very easy to parse and put into some useful information.
Logging the Data:
So, this was going to be my inaugural Splunk blog but I didn’t get off my ass and so my eval of Splunk expired and I have to wait 30 days to use it again (file that under “phuck”). So today we will be going over logging the data with the standard KIWI/SQL (basically a poor man’s Splunk) method.
So the way we log the data, if you haven’t been doing this already, is we configure the Netscaler to send logs to the KIWI Syslog server and we use the custom data source within KIWI to configure a SQL Logging rule. We then create the table, parse the data with a parsing script and voila, instant business intelligence.
Creating the custom KIWI Rule:
First, create the rule “ICA-START/END” with a descriptive filter configured as you see below.

Next you will optionally configure a Display action but more importantly you will configure the Script that parses the data.

Paste the following text (Below) into a file named Script_Parse_AGEE-ICA.txt and save it in the scripts directory of your KIWI install.
Function Main()
Main = “OK”
Dim MyMsg
Dim UserName
Dim Application
Dim SourceIP
Dim DestinationIP
Dim StartTime
Dim EndTime
Dim Duration
Dim SentBytes
Dim RecBytes
Dim ConnectionID
With Fields
UserName = “”
Application = “”
SourceIP = “”
DestinationIP = “”
StartTime = “”
EndTime = “”
Duration = “”
SentBytes = “”
RecBytes = “”
ConnectionID = “”
MyMsg = .VarCleanMessageText
If ( Instr( MyMsg, “ICAEND_CONNSTAT” ) ) Then
SrcBeg = Instr( MyMsg, “Source”) + 6
SrcEnd = Instr( SrcBeg, MyMsg, “:”)
SourceIP = Mid( MyMsg, SrcBeg, SrcEnd – SrcBeg)
DstBeg = Instr( MyMsg, “Destination”) + 11
DstEnd = Instr( DstBeg, MyMsg, “:”)
DestinationIP = Mid( MyMsg, DstBeg, DstEnd – DstBeg)
UserBeg = Instr( MyMsg, “domainname”) + 10
UserEnd = Instr( UserBeg, MyMsg, “-“)
UserName = Mid( MyMsg, UserBeg, UserEnd – UserBeg)
StartBeg = Instr( MyMsg, “startTime “) + 11
StartEnd = Instr( StartBeg, MyMsg, ” “)
StartTime = Mid( MyMsg, StartBeg, StartEnd – StartBeg)
EndBeg = Instr( MyMsg, “endTime “) + 9
EndEnd = Instr( EndBeg, MyMsg, ” “)
EndTime = Mid( MyMsg, EndBeg, EndEnd – EndBeg)
DurBeg = Instr( MyMsg, “Duration “) + 9
DurEnd = Instr( DurBeg, MyMsg, ” “)
Duration = Mid( MyMsg, DurBeg, DurEnd – DurBeg)
SentBeg = Instr( MyMsg, “Total_bytes_send “) + 17
SentEnd = Instr( SentBeg, MyMsg, ” “)
SentBytes = Mid( MyMsg, SentBeg, SentEnd – SentBeg)
RecBeg = Instr( MyMsg, “Total_bytes_recv “) + 17
RecEnd = Instr( RecBeg, MyMsg, ” “)
RecBytes = Mid( MyMsg, RecBeg, RecEnd – RecBeg)
ConBeg = Instr( MyMsg, “connectionId”) +12
ConnectionID = Mid( MyMsg, ConBeg)
Application = “NA”
end if
If ( Instr( MyMsg, “ICASTART” ) ) Then
SrcBeg = Instr( MyMsg, “Source”) + 6
SrcEnd = Instr( SrcBeg, MyMsg, “:”)
SourceIP = Mid( MyMsg, SrcBeg, SrcEnd – SrcBeg)
DstBeg = Instr( MyMsg, “Destination”) + 11
DstEnd = Instr( DstBeg, MyMsg, “:”)
DestinationIP = Mid( MyMsg, DstBeg, DstEnd – DstBeg)
UserBeg = Instr( MyMsg, “domainname”) + 10
UserEnd = Instr( UserBeg, MyMsg, “-“)
UserName = Mid( MyMsg, UserBeg, UserEnd – UserBeg)
AppBeg = Instr( MyMsg, “applicationName”) + 15
AppEnd = Instr( AppBeg, MyMsg, “-“)
Application = Mid( MyMsg, AppBeg, AppEnd – AppBeg)
StartBeg = Instr( MyMsg, “startTime “) + 11
StartEnd = Instr( StartBeg, MyMsg, ” “)
StartTime = Mid( MyMsg, StartBeg, StartEnd – StartBeg)
ConBeg = Instr( MyMsg, “connectionId”) +12
ConnectionID = Mid( MyMsg, ConBeg)
EndTime = “NA”
Duration = “NA”
SentByes = “NA”
RecBytes = “NA”
end if
.VarCustom01 = UserName
.VarCustom02 = Application
.VarCustom03 = SourceIP
.VarCustom04 = DestinationIP
.VarCustom05 = StartTime
.VarCustom06 = EndTime
.VarCustom07 = Duration
.VarCustom08 = SentBytes
.VarCustom09 = RecBytes
.VarCustom10 = ConnectionID
End With
End Function
Next you will create the custom DB format exactly as follows:
(IMPORTANT: NOT SHOWN Make sure you check “MsgDateTime” in this dialog box near the top)

Then you will create a new “Action” called “Log to SQL” and select the Custom DB Format and name the table AGEE_ICA and select “Create Table”. If you have not yet, build your connect string by clicking the box with the three periods at the top “…”

Then watch for ICASTART and ICAEND instances.

Then look at the data in your SQL Server:

Now you can report in real-time on external utilization by the following:
- Utilization by IP Range
- Utilization by Domain
- Utilization by UserID
- Utilization by time of day
- Average Session Duration
- You can tell if someone worked or not (“Yeah, I was on Citrix from 9AM to 5PM”)
Most of the queries you can reverse engineer from Edgesight Under the hood but if there is a specific query you are after just email me.
I get the average session duration with the following query:
select
avg(datepart(mi,cast([duration] as datetime)))
from syslog.dbo.agee_ica
where duration <> ‘NA’
I tried to put everything in one table as you can see from the SQL Data Columns and the parsing script but you can split it up into separate tables if you want.
Thanks for reading!
John
Project Poindexter: (Non-Citrix Related) Grabbing Pix URL logs checking them for malware.
This is my first non-Citrix related post, I don’t plan on making it a habit but someone suggested that I post this in case it is valuable to other INFOSEC types.
Let me start off by saying I am not a traditional security guy, I don’t have an abundance of hacking skills, I am not a black hat, white hat etc. I did work in Security for awhile as the Event Correlation guy for a year and have been trying to leverage digital epidemiology as a way to secure my systems. As I have stated in previous blogs, we have a better chance of curing the common cold than getting rid of malware and 0-day’s. In fact, I would say there are two kinds of systems, breached and about to get breached. This is the way you have to approach malware in my opinion. What surprised me with the Aurora breach was that it appears as though the INFOSEC community spends the lion’s share, if not all, of their time on ingress and completely ignores egress. When I look at the Google breach I see an attack that should have been mitigated within 24 hours.
Over the years I have deployed or viewed a number of event correlation utilities, most of them costing in excess of $250K for a large implementation. What I generally did not like about shrink wrapped solutions and what I am most concerned about in the IT industry is the de-emphasis on heuristics and a dependance on an automated process to detect a problem. In my opinion, an “Event Correlator” is not an appliance, it is an IT Person looking at a series of logs and events and saying “Holy shit! What the HELL is that!”. The fact is, false positives make a lot of really expensive security software completely useless and a stored procedure or IDS/IPS cannot do as good of a job as a human being who can look at a series of logs and make an interpretation. What I want to provide here is some of the heavy lifting that can then be use by a human to determin if there is an issue.
The purpose of this post is to show people how I grabbed Syslog data from my pix allowing me to grab the URI Stem of all outgoing sessions and log them into a SQL Server. Afterward, I will be able to run key queries to be able to troll for .exe, .dll, .tgz and any other problem extensions. Also, I can upload the latest malware list data and cross reference it with the information in my database which will allow me to see if any of my systems are phoning home to a botnet master, malware distribution site, etc. This is basically a take on my edgesightunderthehood.com post on monitoring APT with Edgesight.
The first order of business is to get the logs to the syslog server. I start by creating a filter that will grab the logs. (See Below)

The next step is to parse the incoming data into separate columns in my database. This is done by setting up a custom db format for the purpose of these logs. The parse script is provided below:
Also, check all checkboxes below “Read” and “Write”
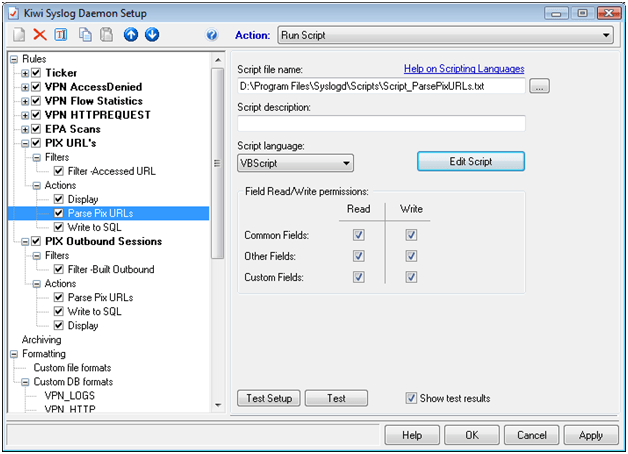
Parsing Script: (Cut and paste it to a text file then use that text file in the dialog box above)
################################
Function Main()
Main = “OK”
Dim MyMsg
Dim Source
Dim Destination
Dim Payload
With Fields
Source = “”
Destination = “”
Payload = “”
MyMsg = .VarCleanMessageText
If ( Instr( MyMsg, “%PIX” ) ) Then
SourceBeg = Instr( MyMsg, “: “) + 2
SourceEnd = Instr( SourceBeg, MyMsg, “Accessed”)
Source = Mid( MyMsg, SourceBeg, SourceEnd – SourceBeg)
DSTBeg = Instr( MyMsg, “URL”) + 3
DSTEnd = Instr( DSTBeg, MyMsg, “:”)
Destination = Mid( MyMsg, DSTBeg, DSTEnd – DSTBeg)
End IF
.VarCustom01 = Source
.VarCustom02 = Destination
.VarCustom03 = Payload
End With
End Function
##################################
The last step is to write the data to SQL but first let’s do a few tasks to prepare the table.
- Set up an ODBC connection to a SQL Server and create a database called “Syslog” and connect to it with an account that has dbo privilages.
-
Create the Custom DB Format for grabbing URL’s
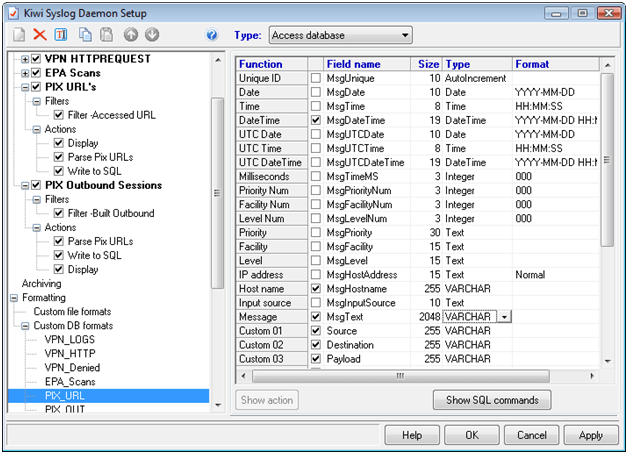
Note that this table will have five columns, msgdatetime, msghostname, msgtext, source, destination and payload. (The last column, payload, is not working yet but I will show you how to get the payload later)
3. Once this is done, create an action called “Write to SQL” and select “PIX_URL” from the custom data fromat list and name the table “PIX_URL” then select “Create Table”

Okay, so now that we have the data writing to SQL Server, let’s look at a month’s worth of data on one of my systems:
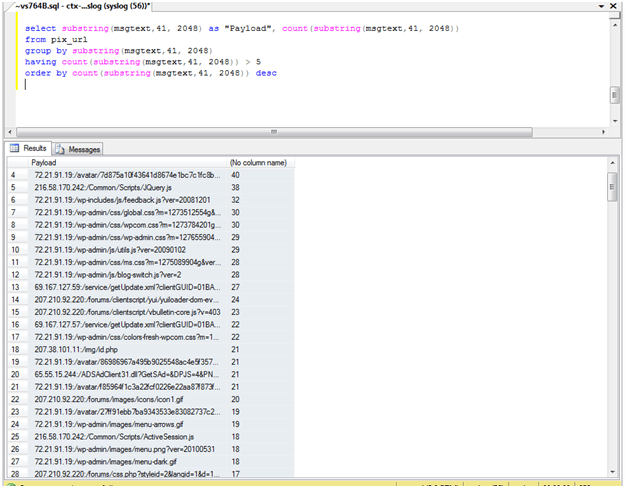
This query will give you the payload and the number of times the payload has been accessed. Using the having function I am going to ask for every uri-stem that has been accessed more than 5 times in the last month.
select substring(msgtext,41, 2048)as “Payload”, count(substring(msgtext,41, 2048))
from pix_url
group by substring(msgtext,41, 2048)
having count(substring(msgtext,41, 2048)) > 5
order by count(substring(msgtext,41, 2048)) desc
The idea behind this is that if you note 1000 records to “123.123.123.123:/botmaster/botnet.exe” you may want to do something about it. You can also download the malwaredomainlist.com data, import it into SQL and cross reference that data to ensure that you are not communicating with any noted malware sites. Depending on the response of this blog, I may post those instructions as well.
And here are what the results look like:
Another query I like to run is one looking for executable files in the URI-stem.
select Msghostname as “Firewall”, Source, Destination, substring(msgtext,41, 2048) as “Payload”
from pix_url
where msgtext like ‘%.exe%’
order by msgdatetime desc
This will allow me to troll for executables that my internal users are accessing, as with most versions of malware, this should show itself early on during the breach.
So how do you monitor?
Well, you don’t have to sit there with query analyzer open all day but you can set up SQL Server Reporting Services to do this chore for you and deliver a dashboard to operations personnel. Here is a quick view of a dashboard that refreshes ever 5 seconds and turns RED when “.exe” is in the URI-Stem. In this scenario, you would be able to investigate the executable that is being downloaded by the client and ensure that it is not malware. You can test this yourself once you set it up by going to any site and typing “/test.exe” at the end.

Conclusion:
Again, I am not a traditional security guy so this could be utterly useless, I am not the PIX guy at my job, I AM the PIX guy at home though. Also, I have found it very useful to check for Malware and 0-Day’s that my anti-virus does not pick up. While I cannot speak with as much authority as a number of CISSP’s and INFOSEC guru’s, I can say that the continued ignorance surrounding egress will allow malware to run amuck. As I stated in a previous blog, it is foolish to beat your chest at the millions of packets you keep out while the few that get in can take anything they want, and leave unmolested. Just like a store has to let some people in then focus on ensuring no one leaves with anything they didn’t pay for, IT Security needs to ease over to this mentality and keep track of what is leaving its networks and where it is being sent. At any rate, if this has value to anyone let me know, I will include the RDL (Report File) online for download if anyone wants to set it up. I know a lot of PIX guys aren’t necessarily web/database guys so if you have any questions, feel free to ask.
Thanks for reading,
John
