Finally, an Edgesight Book! (Yes…I know it is a little late)
I have been a bit busy but I was asked to review a book written by a Citrix Architect named Vaqar Hasan out of Toronto Canada. While Edgesight has been declared End of Life in 2016, it still provides the most detailed metrics for XenApp environments out there today. Also, most folks are still on XenApp 6.5 and will remain so for at least two years so I believe the content is still very relevant to today’s XenApp environments as Citrix shops ease into XenDesktop 7 App Edition.
While it does not offer a great deal of ad hoc queries like the EdgesightUnderTheHood.com site does, it offers some very nice details on laying the groundwork for your Edgesight implementation with detailed instructions on setting up alerts, emails, and environmental considerations such as anti-virus exclusions.
There has not been a great deal of literature around Edgesight and he is only asking ten bucks for the Kindle edition. I think it is important that we support the few IT experts in this industry who take the effort to publish good content and the cost is low enough that you can put it on your corporate p-card.
So if you don’t mind, maybe you can support this guy for helping out.
Thanks!
John
![]()
Go with the Flow! Extrahop’s FLOW_TICK feature
I was test driving the new 3.10 firmware of Extrahop and I noticed a new feature that I had not seen before (it may have been there in 3.9 and I just missed it). There is a new trigger called FLOW_TICK, that basically monitors connectivity between two devices at layer 4 allowing you to see the response times between two devices regardless of L7 Protocol. This can be very valuable if you just want to see if there is a network related issue in the communication between two nodes. Say, you have an HL7 interface or a SQL Server that an application connects to. You are now able to capture flows between those two devices or even look at the Round Trip time of tiered applications from the client, to the web farm to the back end database. When you integrate it with Splunk you get an excellent table or chart of the conversation between the nodes.
The Trigger:
The first step is to set up a triggler and select the “FLOW_TICK” event.
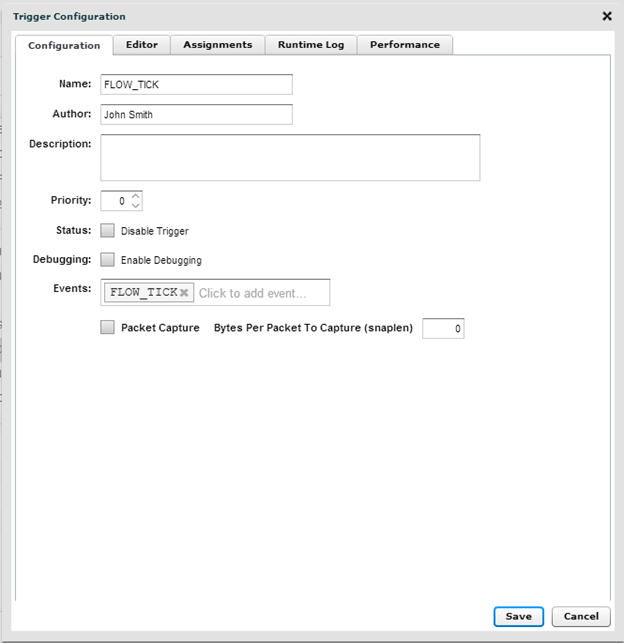
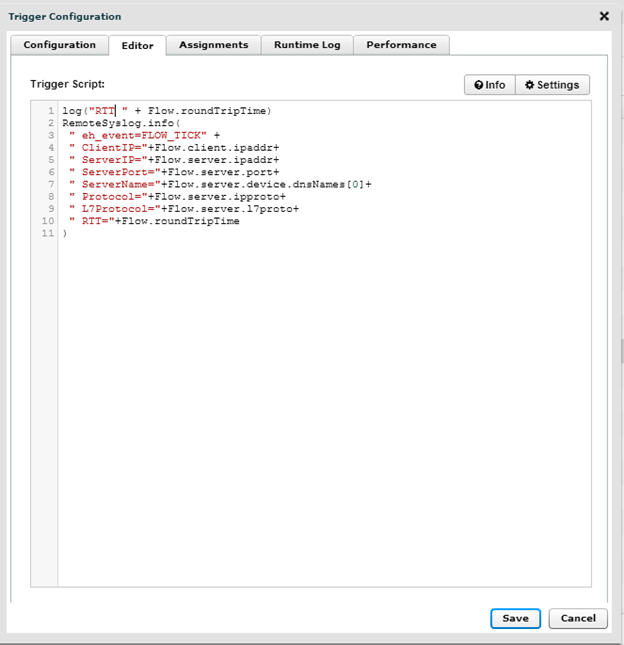
Then click on the Editor and enter in the following Text: (You can copy/Paste the text and it should appear as the graphic below)
log(“RTT ” + Flow.roundTripTime)
RemoteSyslog.info(
” eh_event=FLOW_TICK” +
” ClientIP=”+Flow.client.ipaddr+
” ServerIP=”+Flow.server.ipaddr+
” ServerPort=”+Flow.server.port+
” ServerName=”+Flow.server.device.dnsNames[0]+
” RTT=”+Flow.roundTripTime
)
Integration with Splunk:
So if you have your integration with Splunk set up, you can start consulting your Splunk interface to see the performance of your layer 4 conversations using the following Text:
sourcetype=”Syslog” FLOW_TICK | stats count(_time) as TotalSessions avg(RTT) by ClientIP ServerIP ServerPort
This should give you a table that looks like this: (Note you have the Client/Server the Port and the total number of sessions as well as the Round Trip Time) 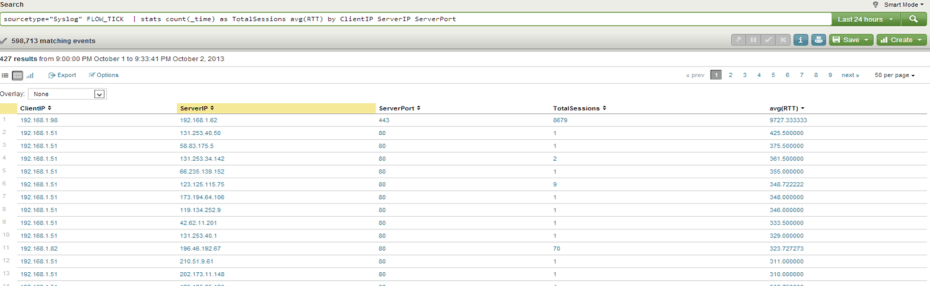
If you want to narrow your search down you can simply put a filter into the first part of your Splunk Query: (Example, if I wanted to just look at SQL Traffic I would type the following Query)
sourcetype=”Syslog” FLOW_TICK 1433
| stats count(_time) as TotalSessions avg(RTT) by ClientIP ServerIP ServerPort
By adding the 1433 (or whatever port you want to filter on) you can restrict to just that port. You can also enter in the IP Address you wish to filter on as well.
INFOSEC Advantage:
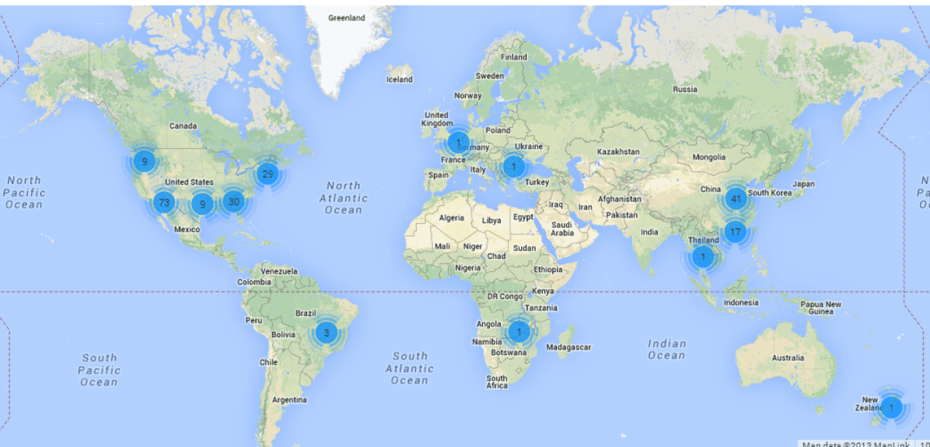
Perhaps an even better function of the FLOW_TICK event is the ability to monitor egress points within your network. One of my soapbox issues in INFOSEC is the fact that practitioners beat their chests about what incoming packets they block but until recently, the few that got in could take whatever the hell they wanted and leave unmolested. Even a mall security guard knows that nothing is actually stolen until it leaves the building. If a system is infected with Malware you have the ability, when you integrate it with Splunk and the Google Maps add-on, to see outgoing connections over odd ports. If you see a client on your server segment (not workstation segment) making a 6000 connections to a server in China over port 8016 maybe that is, maybe, something you should look into.
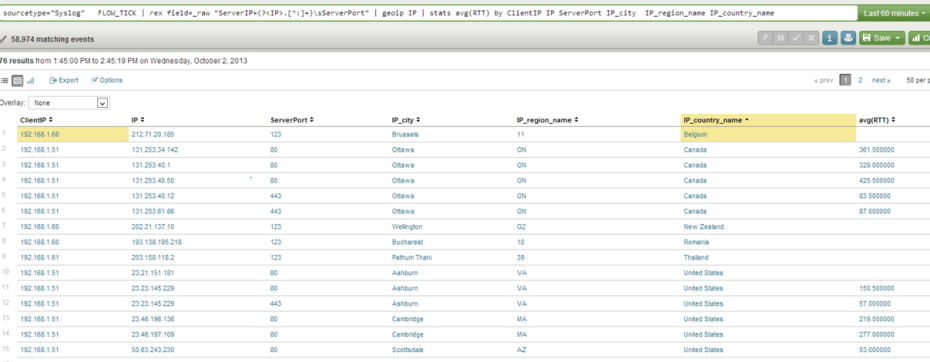
When you integrate with the Splunk Google Maps add-on you can use the following search:
sourcetype=”Syslog” FLOW_TICK | rex field=_raw “ServerIP=(?<IP>.[^:]+)\sServerPort” | rex field=_raw “ServerIP=(?<NetID>\b\d{1,3}\.\d{1,3}\.\d{1,3})” |geoip IP | stats avg(RTT) by ClientIP IP ServerPort IP_city IP_region_name IP_country_name
This will yield the following table: (Note that you can see a number of connections leaving the network to make connections in China and New Zealand, the Chinese connections I made on purpose for this lab and the New Zealand connections are NTP connections embedded into XenServer)
If you suspected you were infected with Malware and you wanted to see which subnets were infected you would use the following Splunk Query:
sourcetype=”Syslog” FLOW_TICK
%MalwareDestinationAddress% | rex field=_raw “ServerIP=(?<IP>.[^:]+)\sServerPort” | rex field=_raw “ClientIP=(?<NetID>\b\d{1,3}\.\d{1,3}\.\d{1,3})” | geoip IP | stats count(_time) by NetID
Geospatial representation:
Even better, if you want to do some big-time geospatial analysis with Extrahop and Splunk you can actually use the Google Maps application you can enter the following query into Splunk:
sourcetype=”Syslog” FLOW_TICK | rex field=_raw “ServerIP=(?<IP>.[^:]+)\sServerPort” | rex field=_raw “ClientIP=(?<NetID>\b\d{1,3}\.\d{1,3}\.\d{1,3})” |geoip IP | stats avg(RTT) by ClientIP NetID IP ServerPort IP_city IP_region_name IP_country_name | geoip IP
Conclusion:
I apologize for the RegEx on the ServerIP field, for some reason I wasn’t getting consistent results with my data. You should be able to geocode the ServerIP field without any issues. As you can see, the FLOW_TICK gives you the ability to monitor the layer 4 communications between any two hosts and when you integrate it with Splunk you get some outstanding reporting. You could actually look at the average Round Trip Time to a specific SQL Server or Web Server by Subnet. This could quickly allow you to diagnose issues in the MDF or if you have a problem on the actual server. From an INFOSEC standpoint, this is fantastic, your INFOSEC team would love to get this kind of data on a daily basis. Previously, I used to use a custom Edgesight Query to deliver a report to me that I would look over every morning to see if anything looked inconsistent. If you see an IP making a 3389 connection to an IP on FIOS or COMCAST than you know they are RDPing home. More importantly, the idea that an INFOSEC team is going to be able to be responsible for everyone’s security is absurd. We, as SyS Admins and Shared Services folks need to take responsibility for our own security. Periodically validating EGRESS is a great way to find out quickly if Malware is running amok on your network.
Thanks for reading
John M. Smith
Where wire data meets machine data
So what exactly IS wire data? We have all heard a lot about Machine data but most folks do not know what wire data is or how it can both augment your existing Operational Intelligence endeavor as well as provide better metrics than traditional APM solutions. Extrahop makes the claim that they are an Agentless solution. They are not unique in the claim but I believe they are pretty unique in the technology. It comes down to a case of trolling and polling. Example: A scripted SNMP process is “polling” a server to see if there are any retransmissions. Conversely Extrahop is Trolling for data as a passive network monitor and sees the retransmissions as they are occurring on the wire. Polling is great as long as the condition you are worried about is happening at the time you do the polling. It is similar to saying “Are you having retransmissions?” (SNMP Polling) vs. “I see you are having a problem with retransmissions”. Both are agentless but there is a profound difference in terms of the value each solution delivers.
Where an agent driven solution will provide insight into CPU, Disk and Memory, wire data will give you the performance metrics of the actual layer 7 applications. It will tell you what your ICA Latency as it is measured on the wire, it will tell you what SQL Statements are running slow and which ones are not, it will tell you which DNS records are failing. The key thing to understand is that Extrahop works as a surveillance tool and is not running on a specific server and asking WMI fields what their current values are. This is profoundly different than what we see in traditional tools in the last 10-12 years.
When Machine data meets Wire Data:
I am now over 9 months into my Extrahop deployment and we have recently started a POC with Splunk and the first task I performed was to integrate Extrahop wire data into the Splunk Big Data back end. All I can say is that it has been like yin and yang. I am extremely pleased with how the two products integrate together and the fusion of wire data with machine data will give my organization a level of visibility that they have never had before. This is, in my opinion, the last piece to the Operational Intelligence puzzle.
In this post I want to talk about three areas where we have been able to see profound improvement in our environment and some of the ways we have leveraged Splunk and Extrahop to accomplish this.
How does data get from Extrahop to Splunk?
Extrahop has this technology called Triggers. Basically, there is a mammoth amount of data flowing through your Extrahop appliances (up to 20GB per Second) and we are able to tap into that data as it is flowing by and send it to Splunk via Syslog. This allows me to tap into CIFS, SQL, ICA, MQSeries, HTTP, MySQL, NFS, ORACLE as well as other Layer 7 flows and allow me to send information from those flows (Such as Statement, Client IP, Server and Process Time for SQL) to Splunk where I can take advantage of their parsing and big data business intelligence. This takes data right off the wire and puts it directly into Splunk. Just like any Unix based system or Cisco device that is set to use Syslog, what I like about Extrahop is the ability to discriminate between what you send to Splunk and what you don’t send to Splunk.
Extrahop/Splunk Integration: SQL Server Queries
Grabbing SQL Queries and reporting on their performance:
One of the most profound metrics we have noted since we started integrating Splunk and Extrahop was the ability to create a flow then cherry pick metrics from it. Below you will see a pair of Extrahop Triggers (the drivers for Splunk integration) the first trigger builds the flow by taking the DB.statement and the DB.procedure fields (pre-parsed on the wire) and creating a flow that you can then tap into when you send you syslog message in the next trigger.
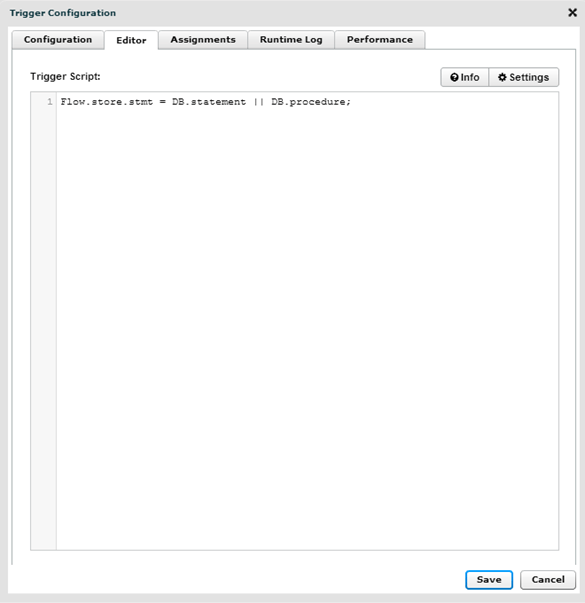
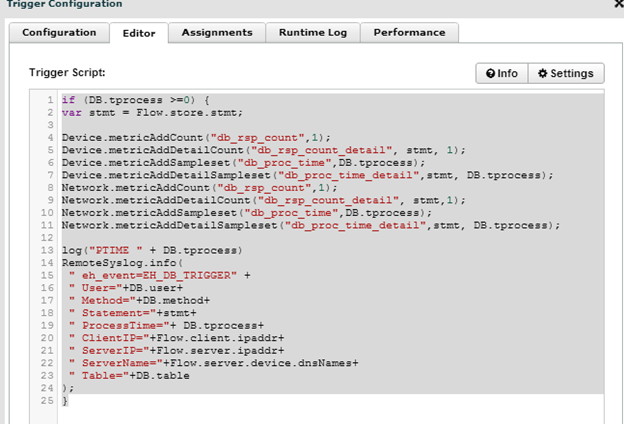
The stmt (var stmt) variable, refers to the flow that we just created above, we will instantiate this flow and pull from it key metrics such as statement and procedure and couple it with the DB.tprocess and then tie in the process time of specific SQL Statements.
At the bottom you see the RemoteSyslog.info command that sends the data to Splunk (or KIWI with SQL, or what we call “skunk”).
Note below, I am NOT logging the database name but that is a trigger option in Extrahop if you have more than one database that uses similar table names. Also note, the condition if (DB.tprocess >=0). I am basically grabbing every database process. This measurement is in milliseconds so if you only wanted to check database queries that took longer than one second it would read if (DB.tprocess>=1000)
For myself, I assign both of these triggers to my Citrix XenApp servers and they are able to report on the database transactions that occur in my Citrix environment. Obviously, you can apply this triggers to your webservices, individual clients as well as the database servers themselves. In my case, I already had a device group for the XenApp servers.
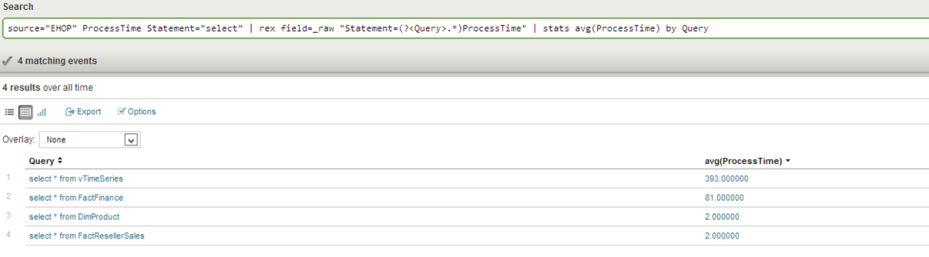
This translates into the metrics you see below where Splunk automatically parses the data for me (YES!) and I am ready to start drilling into it to find problem queries, tables and databases.
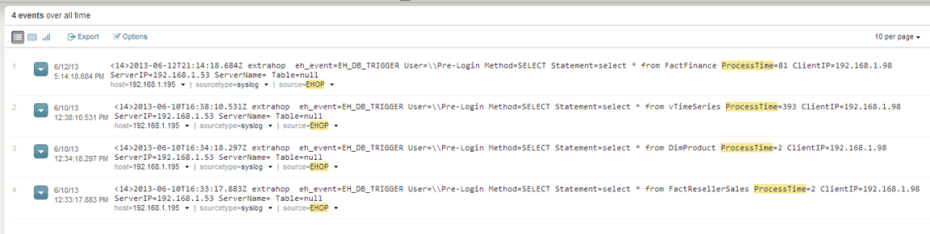
Below you see how easy (well, I recommend the O’Reily “Regular Expressions” book) it is to now parse your wire data to provide the performance of specific queries. As you can see below, this allows you to see the performance of specific queries and get an understanding of how specific tables (and their corresponding indexes) are performing. The information you see in the graphic below can be delivered to Splunk in real-time and you can get this kind of insight without running SQL Profiler. If they are logging into the application with Windows credentials, you will have the user ID as well.
Also, you don’t have to know regex every time, you can save the query below as a macro and never have to type the regex ever again. You can also make that rex field a static column. I am NOT an regex guru, I managed to get every field parsed with a book and Google.
For me this now allows you to report on average process time by:
- Database Server
- User ID
- Database Table (if you know a little regex)
- Database
- Client Subnet
- Client IP Address
- Individual Stored Procedure
Basically, once your data is indexed by Splunk’s Big Data back end, you have “baseball stats” as in it is crazy what you can report on (Example: who hit the most home runs from the left side of the plate in an outdoor stadium during the month of July). You can get every bit as granular as that in your reporting and even more.
Extrahop/Splunk Integration: DNS Errors
Few issues will be as maddening and infuriating as DNS Resolution issues. A windows client can pine for resolution for as long as five seconds. This can create some serious hourglass time for your end users and impact the performance of tiered applications. An errant mistake in a .conf file mapping to an incorrect host can be an absolute needle in a haystack. With the Splunk integration, (Extrahop’s own console does a great job of this as well) you can actually integrate the DNS lookup failures as the happen in real time and take them off the wire and into your Splunk Big Data platform. Below you see the raw data as it happens. (I literally went to a DOS prompt and started typing NSLOOKUP on random thought up names. (The great irony being that in this age of domain squatting, 1/3 of them actually came back!!!!). As my mentor and brother James “Jim” Smith once told me “if you have issues that are sometimes there and sometimes not there, it’s probably DNS” or “If DNS is not absolutely pristine, funny things happen” or my all-time favorite quote from my Brother Jim “Put that GOD DAMN PTR record in or I will kick your phucking ass!” Needless to say, my brother Jim is rather fond of the DNS Failure record keeping of Extrahop.
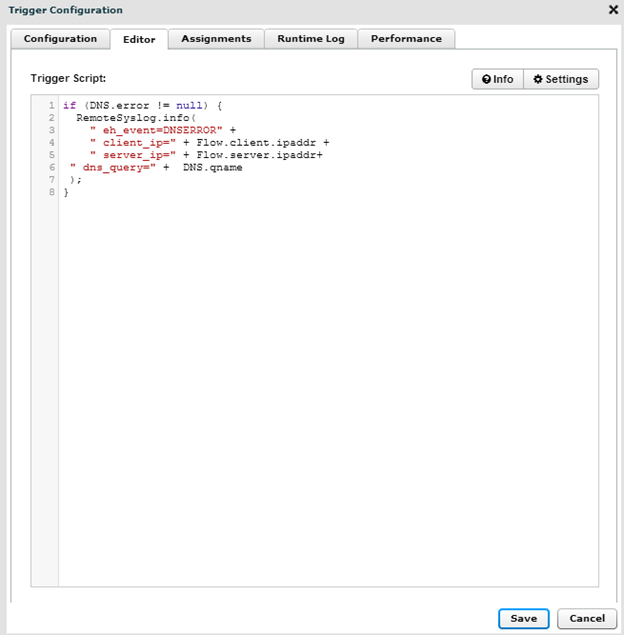
Below you see a very simple trigger that essentially logs the client IP, the DNS Server IP and the DNS Query that was attempted, the condition is set so that it is triggered in the event of an error.
Below is the resultant raw data.
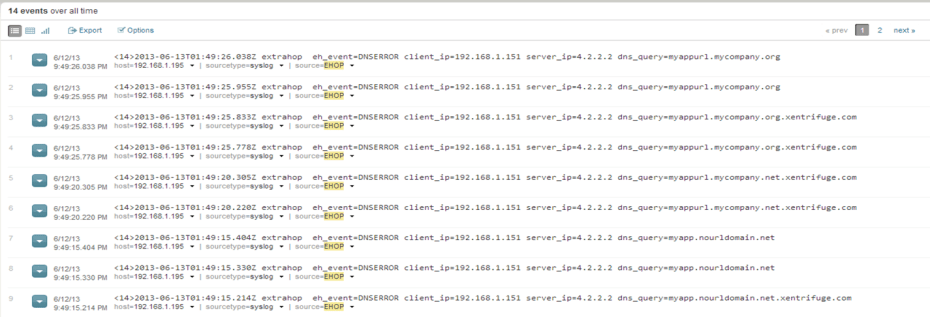
As with the SQL Data we had above, we have more Parsing goodness because we are integrating the data into Splunk: Note the server cycling through the domain DNS Suffix thus doubling the number of failures.
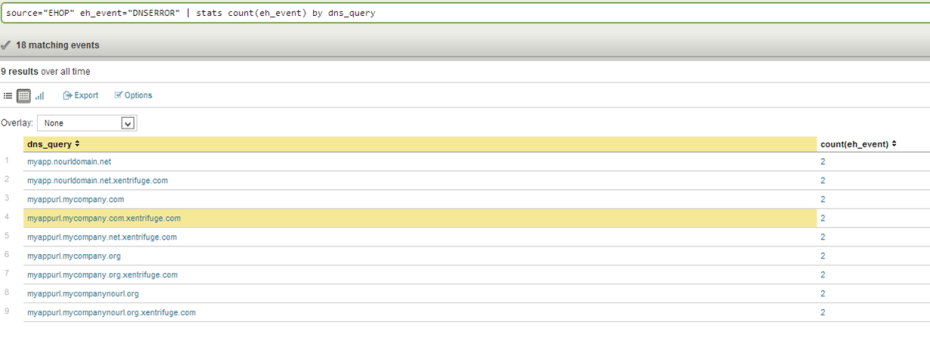
So within the same vein as “baseball stats” you can report on DNS lookup failures by DNS Query (As you see above, those records who fail to be looked up most often) but you also have the ability to report on the following:
- DNS Failures by Client IP and by DNS Query (Which server has the misconfigured conf file)
- DNS Failures by DNS Server
- DNS Failures by Subnet (bad DHCP setting?)
Proper DNS pruning and maintenance takes time, until Extrahop I cannot think of how I would monitor DNS failures outside of wireshark (Great tool but not much big data or business intelligence behind it). The ability to keep track of DNS failures will go a very long way in providing needed information to keep the DNS records tight. This will translate into faster logon times (especially if SRV lookups are failing) and better overall client-server and nth-tiered application performance.
Extrahop/Splunk Integration: Citrix Launch Times
One of the more common complaints of Citrix admins is the slow launch times. There are a number of variables that Extrahop can help you measure but for this section we will simply cover how to keep track of your launch times.
Below you see a basic trigger that will keep track of the load time and login time. I track both of these metrics as often, if the login time is 80-90% of the overall load time you likely need to take a look at group policies or possibly loopback processing. This can give you an idea of where to start. If you have a low logiinTime metric but a high loadTime metric it could be something Network/DNS related. You create this query and assign it to all XenApp Servers.
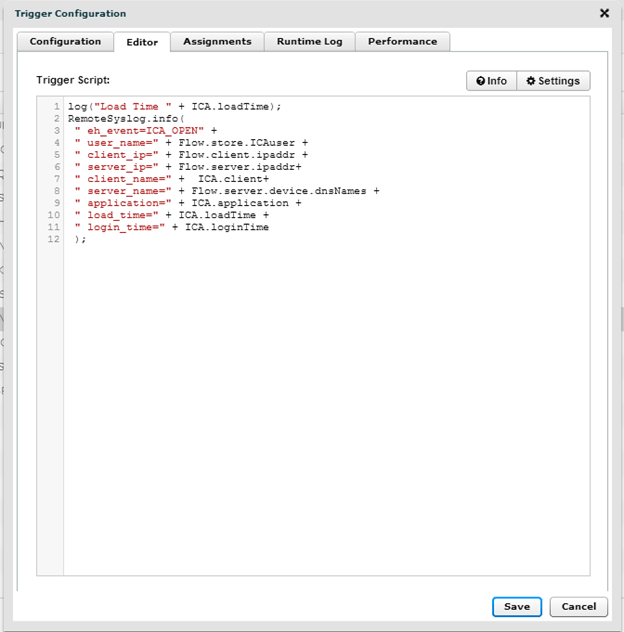
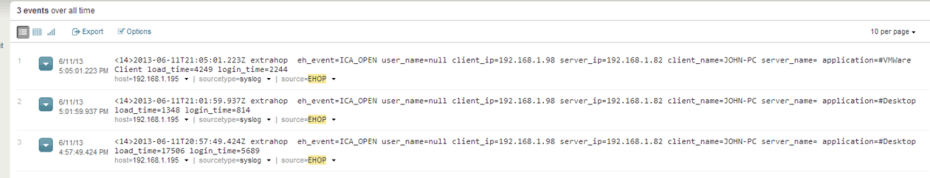
The Raw Data: Below you see the raw data, I am not getting a username yet, there is a trick to that I will cover later but you see below I get the Client Name, Client IP, Server IP and I would have my server name if my DNS was in order (luckily my brother Jim isn’t here)
As with the previous two examples, you now can start to generate metrics on application launch performance.
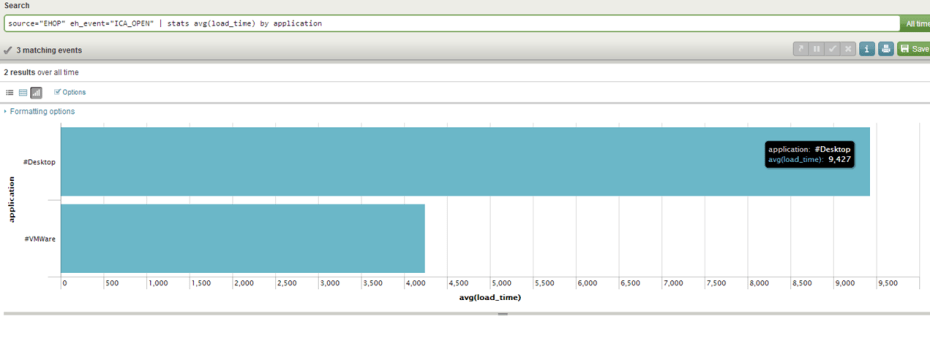
And once again with the baseball stats theme you can get the following metrics once your Extrahop data is integrated into Splunk:
- Average Launch time by UserName
- Average Launch time by Client Name
- Average Launch time by Client IP
- Average Launch time by Customer Subnet (using some regex)
- Average Launch time by Application (as you see above)
- Average Launch time by XenApp Server (pinpoint a problem XenApp server)
Conclusion:
While I did not show the Extrahop console in this post the Extrahop console is quite good, I wanted to show how you could integrate wire data into your Splunk platform and make it available to you along with your machine data. While you are not going to see CPU, Disk IOPS or Memory utilization on the wire, you will seem some extremely telling and valuable data. I believe that all systems and system related issues will manifest themselves on the wire at some point. An overloaded SQL Server will start giving you slower ProcessTime metrics. A flapping switch in an MDF at a remote site might start showing slower Launch Times in Citrix and a misconfigured .conf file may cause lookup failures for your tiered applications that you run. These are all metrics that may not manifest themselves with agent driven tools but you can note them on the wire. Think of Extrahop as your “Pit Boss” engaging in performance surveillance of your overall systems.
I have found the integration between Splunk and Extrahop gives me a level of visibility that I have never had in my career. This is the perfect merger of two fantastic data sources.
In the future I hope to cover integration for HTTP, CIFS as well as discuss the security benefits of sending wire data to Splunk.
Thanks for reading.
John M. Smith
Useful Regex statements
Getting the Subnet ID (24 bit Mask)
This is the REX statement that will let you query for a 24 bit subnet ID. This will let you check Citrix Latency and Load/Launch times by Subnet within a customer’s network.
| rex field=client_ip “(?<net_id>\d+\.\d+\.\d+)” | stats avg(Load) count(load_time) by net_id
Getting performance on SQL INSERT statements:
The REGEX below will allow you to get the actual table that an insert command is updating. This could be useful to see if SQL write actions are not performing as expected. This REX will parse out the table name so that you can check the performance of specific tables.
| rex field=_raw “Statement=insert INTO\s(?<Table>.[^\s]+)”
Getting the Table Name within a SELECT statement:
The REX statement below allows you to get the table that a select statement is running against. Mapping the performance by Table name may give you an indication that you need to re-index.
| rex field=_raw “[fF][rR][oO][mM]\s(?<Table>.[^\s]+)”
Radom Streams of Consciousness during “USE IT OR LOSE IT” vacation: Remote PC is ^&%$!* AWESOME and why isn’t everybody talking about it?
So I am sitting at in the coffee shop at my hotel while I am on the Oregon coast using some of my “use it or lose it” vacation before the year ends. Last night, I literally had the greatest pint of beer in my entire life (India Pelican Ale from the Pelican Bar and Grill in Pacific City Oregon) and have just noticed that the same bar I drank it at is opening for Breakfast at 8 AM. I am wondering if I have a drinking problem because I have now rationalized that it is 11AM (early lunch) on the East coast and I could easily blame drinking this early on Jetlag. Like a lot of IT workaholics, I am really trying to get better at this whole “vacation” thing. At any rate, I thought I would sit down and read Jarian Gipson’s post on Remote PC and try to “get hip” to it as I myself am pretty excited about it.
For the record, I am NOT a VDI guy, that in and of itself is no longer badge of shame and it has been nice to see the virtualization community become more tolerant of those who are not jumping for joy over VDI. That said, I think VDI is totally cool but it is very hard to justify paying more for desktop delivery and trying to sell OPEX savings to CIO’s who worry about the next Quarterly stock call. Selling OPEX in the world of publicly held companies is a tough row to hoe. Then, in May, I read Jarian Gibson’s Blog about Remote PC to which I immediately asked “Can I haz it?”
Now I am excited, this works better than traditional VDI for SO MANY reasons, let’s take 1000 Flex/Teleworkers.
The 1000 Telworker Scenario:
Say you have to set up a telework solution for 1000 remote users. Typically this involves the procurement of 1000 laptops and sending the users home with them then building out the back end infrastructure to support either XenAPP or XenDesktop.
Sending users home with a Laptop and providing VDI Access:
So I am doing some brief estimating but I am assuming a laptop costs around $1000 and supplying 1000 end users with one puts in into the project a cool 1 million dollars out of the gate.
Project Cost so far: $1,000,000
Supporting the back end infrastructure:
A quick rough estimate of VDI memory/core requirements I would say you would need at least 20 servers to accommodate 1000 XenDesktop users. At around $10K per server you are looking at another $200,000 in back end hardware costs (not to mention licensing)
Project Cost so far: $1,200,000
So, in addition to the licensing debacle that you get to go through (one I have since thrown my hands up in disgust over) with Microsoft and the set up of the infrastructure you are 1.2 million into this deployment. We could switch to XenAPP (Now we’re talkin!) to save a little more. If you use VMWare (I don’t want to get involved in the hypervisor holy war) than you are going to have more cost as well.
So with XenAPP, I think you should be able to get by with 9 servers (30 users per 8GB VM w/2 vCPUs). At 9 servers you are looking at $90,000 and you are looking at round $1.09 million for your project. Nice savings but you are still stuck with building out the back end infrastructure.
Remote PC Scenario:
With the remote PC Scenario, we get a chance to actually take advantage of BYOD (bear with me here) and take advantage of the cheap PC models that are out there. We can replace the initial investment from a $1000 Laptop to a $400-$600 desktop (bulk PC purchases get this kind of leverage). This presents an opportunity to reduce that cost from $1 million to $400K-$600K. (Let’s use $500K as a baseline)
Now you’re talking the “language of love” to your CIO, CAPEX. Not only have you reduced the initial procurement costs but you do not need to build out the same amount of back end infrastructure. In the Remote PC scenario, you have your DDC’s brokering the connections but the XenAPP/XenDesktop farms are completely gone or maybe one or two XenAPP Servers for apps like ArcGIS, SAS and CAD.
I have spent hours extrapolating CPU Cores and RAM to try and come up with a user density, in all likelihood you have several thousand cores and several terabytes of RAM sitting at desks and in cubicles that can now be tapped into for remote access using Remote PC.

Why this would work?
While working to set up the teleworking solution at a previous employer we noted a few things. First, after making a seven figure investment in laptops, we found that only 20% of them (that’s a generous number) actually connected to us remotely. The remaining users insisted on using their own equipment. Let’s take my case for example, at my desk at home, I have the “Crackpot Command Center” going with four monitors and a ball busting six core 16GB system (As any true geek would). So, when I want to connect to work, am I supposed to unplug everything and connect my keyboard, mouse and ONE MONTIOR (seriously?) to my Laptop? Maybe two monitors if I have a docking station? No freakin’ way!
Even non-geeks have their setup at home already and I doubt they have a data-switch box to switch back and forth so a teleworker can either work from the kitchen table OR they can UNPLUG their monitor and plug it into the docking station or laptop? The fact is, this is just not likely and the same end user would likely prefer to just use their equipment. This is something I witnessed first-hand to the complete shock of management.
In addition to the BYOD paradigm or UYOD (Use your own device) paradigm you also maintain support continuity. The first time we discussed VDI with our server group my team looked at me like I was crazy. First off, desktop management is 20 years in the making and there are old, established methods of supporting it. A complete forklift of the status quo is much more difficult than just provisioning desktops on the fly.
One of the issues with VDI was the inability to get people to understand that your 5 person Citrix team cannot support 10,000 desktops. Even more, they did not put 5 to 10 years into their IT careers to go back to supporting desktops. I personally am not overly excited to deal with Desktops after 16+ years in this industry and neither are most of the server admins I work with. The inability to integrate XenDesktop/View/ VDI in general, with the incumbent support apparatus at an organization is a significant, and in my opinion, often overlooked barrier to adoption. Your Citrix team likely is not THAT excited about doing it and the desktop team is completely intimidated by it. We go from imaging systems to the “Corporate Image” to setting up PVS, configuring PXE, DHCP Scopes, DHCP failover logging into the hypervisor….etc. Folks, it’s a Dekstop, the level of complexity to do a large scale deployment is far more advanced and much less forgiving than imaging laptops as they come in the door. Advances in SCCM integration for XenDesktop were very welcome and a timely feature but ultimately Remote PC delivers continuity of support as it is little more than an agent installed on the existing PC. The same people who support the PC today can continue to do so, server admins are not being asked to become Desktop Admins and the only thing that changes is that you are extending your infrastructure into the cloud by integrating the DDC and the Access Gateway allowing users the same consistent experience regardless of where they are working from.
You know what, I could BE a VDI guy if:
• I don’t have to put Windows 7 images on my million-dollar SAN (I LOVE Atlantis but it is not safe to assume your Citrix team can put the squeeze on your storage team)
• I don’t have to strong arm Server Admins to do Desktop Support
• I don’t have to buy a 2nd Windows License (or deal with Licensing)
• It can be made consistent enough that the incumbent Desktop team can support it
Holy crap! I’m out of excuses…I think I could become a VDI guy…
Hey CCS! I bet you can even install the Edgesight agent?! (They’ll get the joke) What’s not to like here? Yes, VMware, HP/Dell/Cisco might be a little bent for awhile since you won’t need as much hardware/Hypervisor software and Microsoft might find themselves chagrined as they cannot gauge you for more licensing costs but in the end, you get to simply extend your enterprise into the cloud without drastically changing anyone’s role. This also allows organizations to wade into VDI instead of stand at the end of the high dive at the public pool while Citrix, VMWare and Gartner chanted “JUMP, JUMP, JUMP!”
Isn’t that what we wanted when all this started?
Thanks for reading
John
Preparing for life without Edgesight with ExtraHop
So, the rumors have been swirling and I think we have all come to the quiet realization that Edgesight is going to be coming to an end. At least the Edgesight we know and Love/Hate.
For those of us who have continued with this labor of love trying squeeze every possible metric we could out of Edgesight we are likely going to have to come to grips with the fact that the next generation of Edgesight will not have the same level of metrics we have today. While we all await the next version of HDX Edgesight with we can almost be certain that the data model and all of the custom queries we have written over the last 3 years will not be the same.
Let’s be honest, Edgesight has been a nice concept but there have been extensive problematic issues with the agent both from a CPU standpoint (firebird service taking up 90% CPU) and keeping the versions consistent. The real-time monitoring requires elevated permissions of the person looking into the server forcing you to grant your service desk higher permissions than many engineers are comfortable with. I am, for the most part, a “tools”-hater. In the last 15 years I have watched millions of dollars spent on any number of tools, all of which told me that they would be the last tool I would need and all of them in my opinion where, for the most part, underwhelming. I would say that Edgesight has been tolerable to me and it has done a great job of collecting metrics but, like most tools I have worked with, it is Agent based, also it cannot log in real-time. The console was so unusable that I literally have not logged into it for the last four years. (In case you were wondering why I don’t answer emails with questions about the console).
For me, depending on an agent to tell you there is an issue is a lot like telling someone to “yell for help if you start drowning”. If a person is under water, it’s a little tough for them to yell for help. With agents, if there is an issue with the computer, whatever that is (CPU, Disk I/O, Memory) will likely impact the agent as well. The next best thing, which is what I believe Desktop Director is using, is to interrogate a system via WMI. Thanks to folks like Brandon Shell, Mark Schill and the people at Citrix who set up the Powershell SDK. This has given rise to some very useful scripting that has given us the real-time logs that we have desperately wanted. That works great for looking at a specific XenApp server but in the Citrix world where we are constantly “proving the negative” it does not provide the holistic view that Edgesight’s downstream server metrics provided.
Proving the negative:

As some of you are painfully aware, Citrix is not just a Terminal Services delivery solution. In our world, XenApp is a Web Client, a Database Client, Printing Client and a CIFS/SMB client. The performance of any of these protocols will result in a ticket resting in your queue regardless of the downstream server performance. Edgesight did a great job of providing this metric letting you know if you had a 40 second network delay getting to a DFS share or a 5000ms delay waiting for a server to respond. It wasn’t real-time but it was better than anything I had used until then.
While I loved the data that Edgesight provided, the agent was problematic to work with, I had to wait until the next day to actually look at the data, unless you ran your own queries and did your own BI integration you had, yet another, console to go to and you needed to provide higher credentials for the service desk to use the real-time console.
Hey! Wouldn’t it be great if there were a solution that would give me the metrics I need to get a holistic view of my environment? Even better, if it were agentless I wouldn’t have to worry about which .NET framework version I had; changes in my OS, the next Security patch that takes away kernel level access and just all around agent bloat from the other two dozen agents I already have on my XenApp sever. Not to mention the fact that the decoupling of GUIDs and Images thanks to PVS has caused some agents to really struggle to function in this new world of provisioned server images.
It’s early in my implementation but I think I have found one….Extrahop.
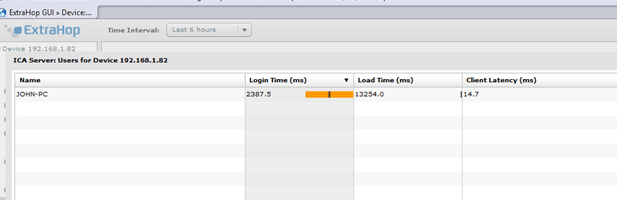
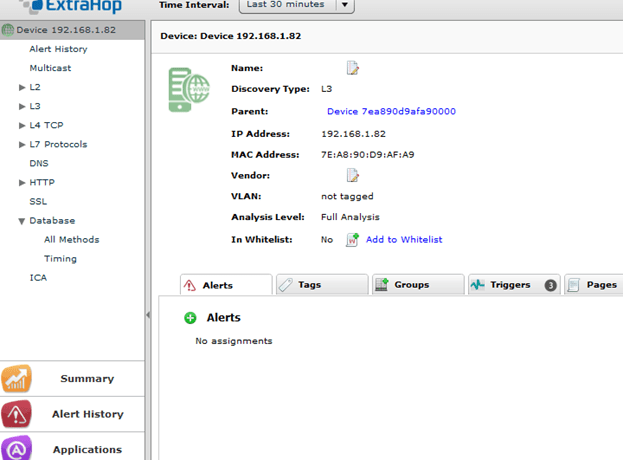
Extrahop is the brain-child of ADC pioneer Jesse Rothstein who was one of the original developers of the modern Application Delivery Controller. The way Extrahop works is that it sits on the wire and grabs pertinent data and makes it available to your engineer and, if you want, your Operations staff. Unlike wireshark, a great tool for troubleshooting; it does not force you, figuratively, to drink water from a fire hose. They have formed relationships with several vendors, gained insight into their packets and are able to discriminate between which packets are useful to you and which packets are not. I am now able to see, in real-time, without worrying about an agent, ICA Launch times and the Authentication time when a user launches an application. I can also see client latency, Virtual Channel Bytes In and Bytes Out for Printer, Audio, Mouse, Clipboard, etc.
(The Client-Name, Login time and overall Load time as well as the Latency of my Citrix Session)
In addition to the Citrix monitoring, it helps us with “proving the negative” by providing detailed data about Database, HTTP and CIFS connections. This means that you can see, in real-time, performance metrics of the application servers that XenAPP is connecting to. If there is a specific URI that is taking 300 seconds to process, you will see it when it happens without waiting the next day for the data or having to go to edgesightunderthehood.com to see if John, David or Alain have written a custom query.
If there is a conf file that has an improper DNS entry, it will show up as a DNS Query failure. If your SQL Server is getting hammered and is sending RTOs, you will see it in real-time/near-time and be able to save yourself hours of troubleshooting.
(Below, you see the different metrics you can interrogate a XenApp server for.)
Extrahop Viewpoints:
Another advantage of Extrahop is that you can actually look at metrics from the point of view of the downstream application servers as well. This means that if you publish an IE Application and it connects to a web server that integrates with a downstream database server you can actually go to that web server you have published in your application and look at the performance of that web server and the database server. If you have been a Citrix Engineer for more than three years, you should already be used to doing the other team’s troubleshooting for them but this will make it even faster. You basically get a true, holistic view of your entire environment, even outside of XenApp, where you can find bottlenecks, flapping interfaces and tables that need indexing. If your clients are on an internal network, depending on your topology you can actually look at THEIR performance on their workstations and tell if the switch in the MDF is saturated.
Things I have noted so far looking at Extrahop Data:
- SRV Record Lookup failures
- Poorly written Database Queries
- Exessive Retransmissions
- Long login times (thus long load times)
- Slow CIFS/SMB Traffic
- Inappropriate User Behavior
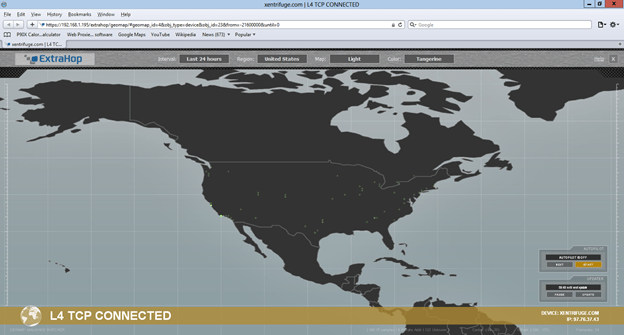
GEOCODING Packets:
Another feature I like is the geocoding of packets, this is very useful to use if you want to bind a geomap to your XenApp servers to see if there is any malware making connections to China or Russia, etc. (I have an ESUTH post on monitoring Malware with Edgesight.) Again, this gives me a real-time look at all of my TCP Connections through my firewall or I can bind it on a per-XenApp, Web Server or even PC node. The specific image below is of my ASA 5505 and took less than 15 seconds to set up (not kidding).
On the wire (Extrahop) vs. On the System (Agent):
I know most of us are “systems” guys and not so much Network guys. Because there is no agent on the system and it works on the wire, you have to approach it a little differently and you can see how you can live without an agent. Just about everything that happens in IT has to come across the wire and you already have incumbent tools to monitor CPU, Memory, Disk and Windows Events. The wire is the last “blind spot” that I have not had a great deal of visibility into from a tools perspective until I started using Extrahop. Yes there was wireshark but for archival purposes and looking at specific streams are not quite as easy. Yes, you can filter and you can “flow TCP Stream” with wireshark but it is going to give you very raw data. I even edited a TCPDUMP based powershell script to write the data to SQL Server thinking I could archive the data that way. I had 20GB of data inside of 30 minutes, with Extrahop you can actually trigger wire captures based on specific metrics and events that it sees in the flow and all of the sifting and stirring is done by Extrahop just leaving you to collect the gold nuggets.
Because it is agentless you don’t have questions like “Will Extrahop support the next edition of XenAPP?” “Will Extrahop Support Windows Server2012” “What version of the .Net Framework do I need to run Extrahop” “I am on Server Version X but my agents are on version Y”
The only question you have to answer to determine if your next generation of hardware/software will be compatible with Extrahop is “Will you have an IP Address?” If your product is going to have an IP Address, you can use Extrahop with it. Now, you have to use RFC Compliant protocols and Extrahop has to continue to develop relationships with vendors for visibility but in terms of deploying and maintaining it, you have a much simpler endeavor than other vendors. The simplicity of monitoring on the wire is going to put an end to some of the more memorable headaches I have had in my career revolving around agent compatibility.
Splunk/Syslog Integration:
So, I recently told my work colleagues that the next monitoring vendor that shows up saying I have to add yet another console I am going to say “no thanks”. While the Extrahop console is actually quite good and gives you the ability to logically collate metrics, applications and devices the way you like, it also has extensive Splunk integration. If there are specific metrics that you want sent to an external monitor, you can send them to your syslog server and integrate them into the existing syslog strategy be it Envision, KIWI Syslog Server or any other SIEM product. They have a javascript based trigger solution that allows you to tap into custom flows and cherry pick those metrics that are relevant to you. Currently, there is a very nice and extensive Splunk APP for Extrahop.
I am currently logging (in real-time) the following with Extrahop:
- DNS Failures (Few people realize how poor DNS can wreck nth-tiered environments)
- ICA OPEN Events (to get logon times and authentication times)
- HTTP User Agent Data
- HTTP Performance Data
So if this works by monitoring the wire, isn’t it the Network team’s tool?
The truth is it’s everybody’s tool, the only thing you need the network team to do is span ports for you (then log in and check out their own important metrics). You can have the DBA log in and check the performance of their queries, the Network Engineers can log in and check jitter, TCP retransmissions, RTOs and throughput, the Citrix guy can log in and check Client Latency, STA Ticket delivery times, ICA Channel throughput, Logon/Launch Times, the Security team can look for TCP Connections to China, Russia and catch people RDPing home to their home networks and the Web Team can go check which user-Agents are the most popular to determine if they need to spend more time accommodating tablets. Everybody has something they need on the wire; I sometimes fear that we tend to select our tools based on what technical pundits tell us too. In our world, from a vendor standpoint, we tend to like to put things in boxes (which is a great irony given everyone’s “think outside the box” buzz statement). We depend on thought leaders to put products in boxes and tell us which ones are leaders, visionaries, etc. I don’t blame them for providing product evaluations that way, we have demanded that. For me, Extrahop is a great APM tool but it is also a great Network Monitoring tool and has value to every branch of my IT Department. This is not a product whose value can be judged by finding its bubble in a Gartner scatter plot.
Conclusion:
I have not even scratched the surface of what this product can do. The triggers engine basically gives you the ability to write nearly any rule you want to log/report any metric you want. Yes, there are likely things you can get with an agent that you cannot get without an agent but in the last few years these agents have become a lot like a ball and chain. You basically install the appliance or import the VM, span the ports and watch the metrics come in. I have had to change my way of thinking of metrics gather from system specific to siphoning data off the wire but once you wrap your head around how it is getting the data you really get a grasp of how much more flexibility you have with this product than with other agent based solutions. The Splunk integration was the icing on the cake.
I hope to record a few videos showing how I am doing specific tasks, but please check out the links below as they have several very good live demos.
To download a trial version: (you have to register first)
http://www.extrahop.com/discovery/
Numerous webinars:
http://www.extrahop.com/resources/
Youtube Channel:
http://www.youtube.com/user/ExtraHopNetworks?feature=watch
Thanks for reading and happy holidays!
John
ICASTART, ICAEND “ICA-LIKE!!!”
In 2008 I had a conversation with Jay Tomlin asking him if he would put in an enhancement for ICA Logging on the AGEE. Basically we wanted the ability to see the external IP Addresses of our customers coming through the Access Gateway. As you are likely aware, what you get in the logs are the IP Addresses bound to the workstation and not the external IP Address that they are coming through. In the last ten years, it has become increasingly rare for an end user to actually plug their computer directly into the internet and more often, they are proxied behind a Netgear, Cisco/Linksys, and Buffalo switch. This makes reporting on where the users are coming from somewhat challenging.
Somewhere between 9.2 and 9.3 the requested enhancement was added and it included other very nice metrics as well. The two syslog events I want to talk about are ICASTART and ICAEND.
ICASTART:
The ICASTART event contains some good information in addition to the external IP. Below you see a sample of the ICASTART log.
12/09/2012:14:40:46 GMT ns 0-PPE-0 : SSLVPN ICASTART 540963 0 : Source 192.168.1.98:62362 – Destination 192.168.1.82:2598 – username:domainname mhayes:Xentrifuge – applicationName Desktop – startTime “12/09/2012:14:40:46 GMT” – connectionId 81d1
As you can see, if you are a log monger, this is a VERY nice log!! (Few can appreciate this) With the exception of the credentials everything is very easy to parse and place into those nice SQL Columns I like. If you have Splunk, parsing is even easier and you don’t have to worry about how the columns line up.
ICAEND:
The ICAEND even actually has quite a bit more information and were it not for the need to report ICA Sessions in real time, this is the only log you will need. Below is the ICAEND log.
12/09/2012:14:41:12 GMT ns 0-PPE-0 : SSLVPN ICAEND_CONNSTAT 541032 0 : Source 192.168.1.98:62362 – Destination 192.168.1.82:2598 – username:domainname mhayes:Xentrifuge – startTime “12/09/2012:14:40:46 GMT” – endTime “12/09/2012:14:41:12 GMT” – Duration 00:00:26 – Total_bytes_send 9363 – Total_bytes_recv 587588 – Total_compressedbytes_send 0 – Total_compressedbytes_recv 0 – Compression_ratio_send 0.00% – Compression_ratio_recv 0.00% – connectionId 81d16
Again, another gorgeous log that is very easy to parse and put into some useful information.
Logging the Data:
So, this was going to be my inaugural Splunk blog but I didn’t get off my ass and so my eval of Splunk expired and I have to wait 30 days to use it again (file that under “phuck”). So today we will be going over logging the data with the standard KIWI/SQL (basically a poor man’s Splunk) method.
So the way we log the data, if you haven’t been doing this already, is we configure the Netscaler to send logs to the KIWI Syslog server and we use the custom data source within KIWI to configure a SQL Logging rule. We then create the table, parse the data with a parsing script and voila, instant business intelligence.
Creating the custom KIWI Rule:
First, create the rule “ICA-START/END” with a descriptive filter configured as you see below.

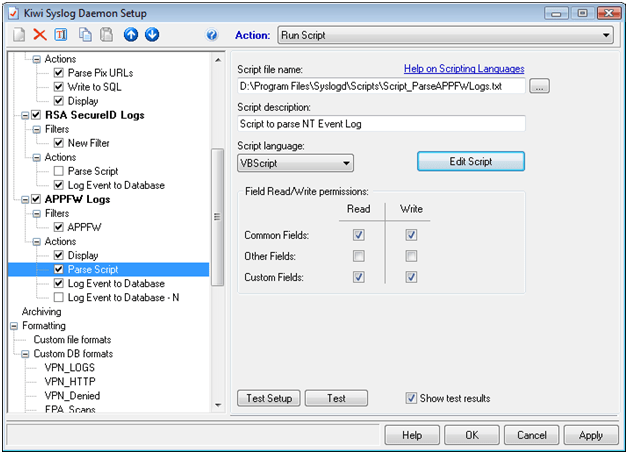
Next you will optionally configure a Display action but more importantly you will configure the Script that parses the data.

Paste the following text (Below) into a file named Script_Parse_AGEE-ICA.txt and save it in the scripts directory of your KIWI install.
Function Main()
Main = “OK”
Dim MyMsg
Dim UserName
Dim Application
Dim SourceIP
Dim DestinationIP
Dim StartTime
Dim EndTime
Dim Duration
Dim SentBytes
Dim RecBytes
Dim ConnectionID
With Fields
UserName = “”
Application = “”
SourceIP = “”
DestinationIP = “”
StartTime = “”
EndTime = “”
Duration = “”
SentBytes = “”
RecBytes = “”
ConnectionID = “”
MyMsg = .VarCleanMessageText
If ( Instr( MyMsg, “ICAEND_CONNSTAT” ) ) Then
SrcBeg = Instr( MyMsg, “Source”) + 6
SrcEnd = Instr( SrcBeg, MyMsg, “:”)
SourceIP = Mid( MyMsg, SrcBeg, SrcEnd – SrcBeg)
DstBeg = Instr( MyMsg, “Destination”) + 11
DstEnd = Instr( DstBeg, MyMsg, “:”)
DestinationIP = Mid( MyMsg, DstBeg, DstEnd – DstBeg)
UserBeg = Instr( MyMsg, “domainname”) + 10
UserEnd = Instr( UserBeg, MyMsg, “-“)
UserName = Mid( MyMsg, UserBeg, UserEnd – UserBeg)
StartBeg = Instr( MyMsg, “startTime “) + 11
StartEnd = Instr( StartBeg, MyMsg, ” “)
StartTime = Mid( MyMsg, StartBeg, StartEnd – StartBeg)
EndBeg = Instr( MyMsg, “endTime “) + 9
EndEnd = Instr( EndBeg, MyMsg, ” “)
EndTime = Mid( MyMsg, EndBeg, EndEnd – EndBeg)
DurBeg = Instr( MyMsg, “Duration “) + 9
DurEnd = Instr( DurBeg, MyMsg, ” “)
Duration = Mid( MyMsg, DurBeg, DurEnd – DurBeg)
SentBeg = Instr( MyMsg, “Total_bytes_send “) + 17
SentEnd = Instr( SentBeg, MyMsg, ” “)
SentBytes = Mid( MyMsg, SentBeg, SentEnd – SentBeg)
RecBeg = Instr( MyMsg, “Total_bytes_recv “) + 17
RecEnd = Instr( RecBeg, MyMsg, ” “)
RecBytes = Mid( MyMsg, RecBeg, RecEnd – RecBeg)
ConBeg = Instr( MyMsg, “connectionId”) +12
ConnectionID = Mid( MyMsg, ConBeg)
Application = “NA”
end if
If ( Instr( MyMsg, “ICASTART” ) ) Then
SrcBeg = Instr( MyMsg, “Source”) + 6
SrcEnd = Instr( SrcBeg, MyMsg, “:”)
SourceIP = Mid( MyMsg, SrcBeg, SrcEnd – SrcBeg)
DstBeg = Instr( MyMsg, “Destination”) + 11
DstEnd = Instr( DstBeg, MyMsg, “:”)
DestinationIP = Mid( MyMsg, DstBeg, DstEnd – DstBeg)
UserBeg = Instr( MyMsg, “domainname”) + 10
UserEnd = Instr( UserBeg, MyMsg, “-“)
UserName = Mid( MyMsg, UserBeg, UserEnd – UserBeg)
AppBeg = Instr( MyMsg, “applicationName”) + 15
AppEnd = Instr( AppBeg, MyMsg, “-“)
Application = Mid( MyMsg, AppBeg, AppEnd – AppBeg)
StartBeg = Instr( MyMsg, “startTime “) + 11
StartEnd = Instr( StartBeg, MyMsg, ” “)
StartTime = Mid( MyMsg, StartBeg, StartEnd – StartBeg)
ConBeg = Instr( MyMsg, “connectionId”) +12
ConnectionID = Mid( MyMsg, ConBeg)
EndTime = “NA”
Duration = “NA”
SentByes = “NA”
RecBytes = “NA”
end if
.VarCustom01 = UserName
.VarCustom02 = Application
.VarCustom03 = SourceIP
.VarCustom04 = DestinationIP
.VarCustom05 = StartTime
.VarCustom06 = EndTime
.VarCustom07 = Duration
.VarCustom08 = SentBytes
.VarCustom09 = RecBytes
.VarCustom10 = ConnectionID
End With
End Function
Next you will create the custom DB format exactly as follows:
(IMPORTANT: NOT SHOWN Make sure you check “MsgDateTime” in this dialog box near the top)

Then you will create a new “Action” called “Log to SQL” and select the Custom DB Format and name the table AGEE_ICA and select “Create Table”. If you have not yet, build your connect string by clicking the box with the three periods at the top “…”

Then watch for ICASTART and ICAEND instances.

Then look at the data in your SQL Server:

Now you can report in real-time on external utilization by the following:
- Utilization by IP Range
- Utilization by Domain
- Utilization by UserID
- Utilization by time of day
- Average Session Duration
- You can tell if someone worked or not (“Yeah, I was on Citrix from 9AM to 5PM”)
Most of the queries you can reverse engineer from Edgesight Under the hood but if there is a specific query you are after just email me.
I get the average session duration with the following query:
select
avg(datepart(mi,cast([duration] as datetime)))
from syslog.dbo.agee_ica
where duration <> ‘NA’
I tried to put everything in one table as you can see from the SQL Data Columns and the parsing script but you can split it up into separate tables if you want.
Thanks for reading!
John
Gratuitous Speculation: Cisco looks at Acquiring Netscaler from Citrix
Today istockanalyst and Network World speculated that Cisco would acquire the Citrix Networking (formerly ANG) line of products. Since the acquisition in 2003, Citrix has tried to brand itself as a Networking company AND a virtualization company. I recall talking with my Sales Manager and hearing her tell me how she needed to try to sell Netscalers to our incumbent Networking team where I was working at the time.
I have often referred to Network teams in organizations as the “Cisco Mafia” and explained to her that talking to the Network team about anything that was not F5, Juniper or Cisco may not bear a great deal of fruit. I recall several battles just to get my Netscalers implemented because I was “Load Balancing” on something other than Cisco and F5. I explained to them that what I had was a “Layer 7 switch” and that calling it a load balancer is a misnomer. The Netscaler is so many more things than just a load balancer.
Why this might be a bad thing?
Well, that depends, if this is a true acquisition meaning CISCO now “owns” Netscaler I worry what happens to the innovation after the acquisition. The fact is Cisco struggled in this space, at least to beat out Citrix and Big IP. I think this is due largely to the “Networking” mentality and Cisco’s inability to innovate beyond layer 3-4. I am NOT down on Network engineers and I have mad respect for their abilities but I have to point out that the ADC is its own hybrid skill set. Discussions such as Context Switching, XML Cross Site Scripting protection and URL Rewrites are not every day conversations for the guys running your Network. As the ADC has matured, the hybrid skill set needed to support it has also broadened. This has become a bit of a challenge in what seems to be (at least as a grey haired IT guy seeing next generation come in) a world of “specialists”. Can Cisco continue the innovation that exists with the market leaders in this space? If they could, why are they phasing out ACE? Are they even interested in it? If it is true that this will become a 2 billion dollar market, that may be the case. If not, does the Netscaler become another CSS or ACE? The reality is, a lot of companies have the “if you can’t beat ’em, buy ’em” mentality but my worries are what will happen afterward. $2 billion may be all the motivation they need.
Why this might be a good thing?
If this is truly an OEM agreement this could be fantastic for Citrix. I remember when Citrix first started selling Netscalers and I think one of the misunderstood dynamics by the Citrix brass was that they were sending their sales staff into just another meeting. “These aren’t my people” I recall one SE saying. I have fought more than one battle over Netscalers that would not have been necessary had they sported a sleek green Cisco bezel on them. The fact is, when enterprise networking is discussed, as stated, Citrix is the “kid doing his own thing” for those of you who grew up watching Sesame street. They are generally not in the conversation like Cisco, BigIP and Juniper are. Server sales vendors will always be outsiders to networking groups. Oddly, the UCS seems to be widely accepted by server teams but for some reason, it just isn’t the other way around.
Cisco partners and sales engineers can offer a bridge to these Networking groups. The biggest challenge is going to be how they sell it. It isn’t quite as easy as just putting a Cisco bezel on the Netscaler. You still have a great product in F5 and Cisco sales engineers will need to be able to go toe to toe with the current market share leader in that space. Ultimately, not having a stranger in the room may be just what Citrix needs to seize the lion’s share of what is predicted to be a $2 billion dollar market.
Thanks for reading!
John
Doing it Cheap, and Right, with Kiwi Syslog Server, SQL and Netscaler Application Firewall
Last week I noted an interesting blog from the guys at Splunk who have developed a way to parse and display Application Firewall blocks and place them into a nice dashboard. Splunk has been doing some interesting stuff here in the last 12 months or so that Citrix Administrators should take note of, especially if they are feeling the pain of real-time monitoring in their Citrix Environment. First off, they hired/contracted Brandon Shell and Jason Conger to work with them. I can tell you that over the years I have had my share of monitoring “tools” shoved down my throat and the majority of them were NETWORKING tools built by NETWORKING companies to support NETWORKING professionals who then tried to retrofit the product to monitor servers.
The Citrix environment alone has its own quarks when it comes to monitoring had having Brandon and Jason on the Splunk team will pretty much ensure that they will build the absolute most relevant monitoring tool out there for supporting Citrix enterprises. While this is not meant to be a glowing endorsement of Splunk it is an endorsement of the two professionals they have hired to build out their Citrix vision.
This article is to cover how I am doing SOME of what splunk is doing at a fraction (almost free) of the cost that you would spend on monitoring products, including splunk. In the last few years I have posted collecting and logging Netscaler syslogs to SQL Server for the purpose of dashboarding VPN Utilization, Endpoint Analysis Scan Results as well as logging Pix Logs to SQL Server via KIWI as well. In this post, I will show you some of what I have been doing for the last few years with my APP Firewall Logs by putting them into KIWI and then writing them to a SQL Server.
Setting up KIWI:
- Set up a Filter for KIWI to catch the APP Firewall Logs:

2. Use this Parsing Script
Function Main()
Main = “OK”
Dim MyMsg
Dim Offense
Dim Action
Dim Source
With Fields
Offense = “”
Action = “”
Source = “”
MyMsg = .VarCleanMessageText
If ( Instr( MyMsg, “APPFW” ) ) Then
OffenseBeg = Instr( MyMsg, “APPFW”) + 6
OffenseEnd = Instr( OffenseBeg, MyMsg, ” “)
Offense = Mid( MyMsg, OffenseBeg, OffenseEnd – OffenseBeg)
end if
If ( Instr( MyMsg, “<blocked>” ) ) Then
Action = “BLOCKED”
End If
If ( Instr( MyMsg, “<not blocked>” ) ) Then
Action = “NOT BLOCKED”
End If
If ( Instr( MyMsg, “<transformed>” ) ) Then
Action = “TRANSFORMED”
End If
If ( Instr( MyMsg, “.” ) ) Then
SourceBeg = Instr( MyMsg, “: “) +3
SourceEnd = Instr( SourceBeg, MyMsg, ” “)
Source = Mid( MyMsg, SourceBeg, SourceEnd – SourceBeg)
End If
.VarCustom01 = Offense
.VarCustom02 = Action
.VarCustom03 = Source
End With
End Function
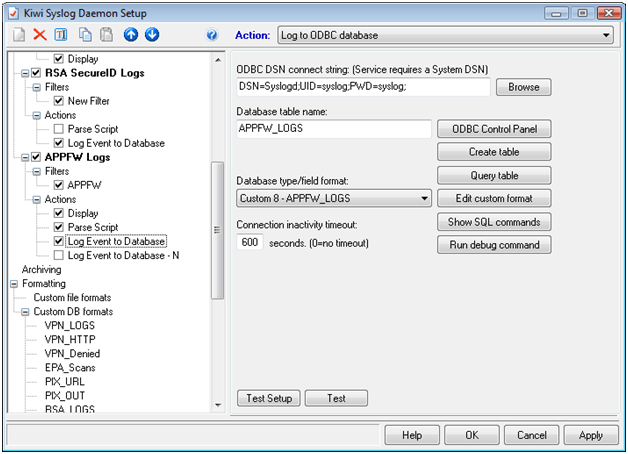
Set up Custom Data Connectors:

Configure database connection and create the table:
Once you have created the table you should start to see some data come in as the App Firewall blocks IP’s. I used the free version of Netsparker to generate some blocks and ran the following query and got the results below:

While it is not totally visible, the “MsgText” column includes the entire log, this may be necessary as forensic evidence as some jurisdictions require the entire log, unparsed, for evidence.
So John, why SQL and not just Splunk?
I have heard folks say that Splunk is expensive, and it might be but in the realm of monitoring tools I believe it is likely less expensive than most others. For me I needed the data to be portable so that I could cross reference it with different tables. In my case, I usually reference my sources with a GEO-Spatial table as well as with a Malware Blacklist. If you are in the DMZ currently, it is not a bad idea to collect INTEL on who is performing recon scans or probes against your systems. Having the data in a SQL Server allows me to set up stored procedures that will alert me if specific metrics are met. Also, a preponderance of malfeasance can be escalated to your INFOSEC team and you can be much more proactive in blocking hosts. Below is a query I run that references the GEOIP table that I have. I changed my IP Address to an IP Address from China to show how you can cross reference the data.

You can see where a large number of blocks have come from China (well, not really) and this is something you may want to escalate. Usually, hackers are not dumb enough to try something like this. My experience is that you will need to look for things like a consistent delta between probes, that kind of stuff. At any rate, without portability, this would be tough to do with a flat file database although I do believe Splunk has an API that could ease some of this.
Conclusion:
Data portability, for me, is the plumb here, this goes beyond making a pretty graph and moves forward into the long term battle against OWASP top ten in that you can gather INTEL and position yourself to know which IP’s are risky and which IP’s just have some bot or malware on them. Ultimately, if you are not a “SQL-phile” or a programming hack like me this may not be the best option. Folks like Sam Jacobs are a great resource as he is another guy who is very adept at getting Syslogs into SQL. I expect with the additions of Conger and Shell you will see great things come out of Splunk for monitoring Citrix environments. There are a number of new and cool things that they are doing that I need to “get hip” to. If you are struggling with your budget and have some basic SQL Skills, this may be a great option for you to get similar metrics and reporting that you can get with Splunk for a fraction of the price.
I apologize for the delay in posts, I plan on getting at least one post a month up for both xen-trifuge and Edgesight under the Hood.
Take care
John
The Evolution of the Remote Campus: HR 1722
In December of 2010 President Obama signed HR 1722, the Telework Enhancement Act of 2010. Basically this means that every Federal Agency has, now, less than 6 months to come up with a telework strategy for nearly 2 million federal employees. Recent storms in DC have caused sabers to rattle in the last two years to develop a telework strategy for business continuity. However in an era of wage freezing, cuts and layoffs telework eligibility could mean the difference between key personnel staying or trying their luck in the private sector. One day a week at home in the DC Area could easily be the equivalent of $1000 or more back into an employee’s pocket.
Threaded into the legislation were requirements about reporting on the participation, providing for accountability and training employees on telework. I wanted to take the time to cover some of the concerns that come with this legislation and dispel the idea that somehow IT organizations are suddenly going to flip a switch and become teleworking hubs overnight. At my agency we recently had snow storms that all but shut down the city yet, well over half of the effected users were able to work at home as if it were business as usual. This did not happen with the flip of a switch and it took a few years of careful planning and painful lessons for us to get in a position to have this kind of success during the recent snow event.
Our solution is Citrix from stem to stern, a user connects to an AGEE and runs via a Virtual Desktop, either XenAPP or XenDesktop. We use Edgesight to monitor and alert on key metrics as well as to provide reporting and accountability.
There are a large number of resources concerning how to set up XenAPP and XenDesktop including how to work with profiles, how to size and scale your systems and I am not going to recreate the wheel here but I do want to go over some concerns that can potentially be forgotten as you plan a transition to having 10-20 percent of your workforce connecting remotely. Also, most remote access throughout the Federal Government is either VPN or Citrix, I want to contrast the benefits and risks of each technology and point out why I think thin computing may be the best answer when it comes to a large scale remote access solution.
Hopefully your agency has Citrix expertise on hand, if not, please do not be afraid to reach out to Citrix Partners who can work with your incumbent IT Staff or Systems Integrators such as Perot, Lockheed, IBM, EDS, etc. These guys are fiends at implementation of Citrix XenAPP and XenDesktop and will help train/transition your staff.
Bandwidth:
Prior to my latest non-fiber provider I had used both AT&T Uverse and FIOS. Both of these vendors provided 14+ MB download speeds. My current provider gives me about a 10MB download. This is great for surfing the web, delivering rich content on websites and watching movies on Netfix. For remote access solutions, these new high speed broadband connections can sap your agencies bandwidth post-haste. You have to ask yourself, is my agency ready to become an ASP? I am currently setting up a Citrix SSL VPN for my agency and as part of the testing I went o my local CIFS share and downloaded a 100mb file, my speed actually got up to 5mb per second! I was thrilled to see how fast the file came down. Now, bring on 1000-3000 of my friends, all of us using VPN and what we have is a meltdown as my agencies’ bandwidth rapidly dwindles. While I was able to get up to 5mb down on my VPN connection, my equally productive, Citrix ICA Session hovers between 20K and 60K. Will my YouTube experience be the same? No, but it is good enough and I am consuming at least 125 times less bandwidth.
The table and subsequent chart below were taken from this website showing the number of government employees at a number of DC area agencies. According to Citrix Online in an article here, 61% of all government employees are in a “telework eligible” position. So for example in the table below you see that the department of Veterans Affairs has 8000 DC Area employees.
If 61% of the VA Employees are telework eligible and the work at home one day a week, that means 8000 employees times .61 divided by 5 would mean that 976 employees would be teleworking per day.
| Agency |
Employees in thousands |
Metro DC Area employees in thousands |
| Executive departments |
1,664 |
238 |
| Defense, total |
652 |
68 |
| Army |
244 |
20 |
| Navy |
175 |
25 |
| Air Force |
149 |
6 |
| Other |
84 |
17 |
| Veterans Affairs |
280 |
8 |
| Homeland Security |
171 |
23 |
| Justice |
108 |
24 |
| Treasury |
88 |
12 |
| Agriculture |
82 |
8 |
| Interior |
67 |
7 |
| Health and Human Services |
64 |
30 |
| Transportation |
55 |
9 |
| Commerce |
39 |
20 |
| Labor |
16 |
6 |
| Energy |
15 |
5 |
| State |
15 |
12 |
| Housing and Urban Development |
9 |
3 |
| Education |
4 |
3 |
To calculate the bandwidth I used 1MB as the reference for VPN, I feel like this is pretty low but I think you would have to at least earmark 1MB per person if you were to scale out a VPN Solution. I used 60KB for ICA, that is generally pretty accurate for a normal ICA Session that does not have heavy graphics. So with that you can see the difference in providing remote access via full VPN vs. ICA. In the case of the VA we can see that around 1GB would be needed to support 976 users via VPN and they would need around 60MB to support the same number of users via ICA. From a bandwidth perspective that is a huge savings.
| Agency |
1000’s empl |
In Metro DC |
20% Teleworkers |
VPN BW |
ICA BW |
| Army |
244 |
20 |
2440 |
2.50 |
0.14 |
| Navy |
175 |
25 |
3050 |
3.12 |
0.18 |
| Air Force |
149 |
6 |
732 |
0.75 |
0.04 |
| Other |
84 |
17 |
2074 |
2.12 |
0.12 |
| Veterans Affairs |
280 |
8 |
976 |
1.00 |
0.06 |
| Homeland Security |
171 |
23 |
2806 |
2.87 |
0.16 |
| Justice |
108 |
24 |
2928 |
3.00 |
0.17 |
| Treasury |
88 |
12 |
1464 |
1.50 |
0.09 |
| Agriculture |
82 |
8 |
976 |
1.00 |
0.06 |
| Interior |
67 |
7 |
854 |
0.87 |
0.05 |
| Health and Human Services |
64 |
30 |
3660 |
3.75 |
0.21 |
| Transportation |
55 |
9 |
1098 |
1.12 |
0.06 |
| Commerce |
39 |
20 |
2440 |
2.50 |
0.14 |
| Labor |
16 |
6 |
732 |
0.75 |
0.04 |
| Energy |
15 |
5 |
610 |
0.62 |
0.04 |
| State |
15 |
12 |
1464 |
1.50 |
0.09 |
| Housing and Urban Development |
9 |
3 |
366 |
0.37 |
0.02 |
| Education |
4 |
3 |
366 |
0.37 |
0.02 |
Bandwidth Cart showing bandwidth requirements for VPN at 1MB vs. ICA at 60KB.

I am not trying to scare anyone with the bandwidth comparisons rather I am trying to drive home the paradigm shift that must take place in terms of what you deliver externally. You agency must be ready to transition from delivering just web content and maybe Remote Access to a few hundred users to becoming a service provider to several hundred remote users. Do you have the bandwidth to support 20% of your eligible workforce working remotely? I know 60KB looks a lot better than 1MB plus performance of client/server applications are going to be considerably better because transactions can occur on the switched network.
And finally, I want to quickly touch on your switched infrastructure. While you may have a campus of 2500 users they are likely distributed across as many as 10-20 switches and bandwidth is more than enough per person. While the ICA Bandwidth from the XenAPP or XenDesktop machine to the end user may only be 60K, from the XenApp/XenDesktop system to downstream applications, it is full SMB, TCP, SSL, HTTP, RTSP, etc. If you are going from supporting 2500 users across 20 switches to supporting 2500 users on two to four switches you need to make sure that the those switches can handle the sudden influx of usage. You need to treat your “Remote Campus” just like any other campus you have and you will need bandwidth similar to that of a core switch.
Security:
Another big challenge to a large scale remote access solution is security. I think the current status quo is that most VPN users are IT Staff and a few other select users that the agency allows to have VPN Access. Even with today’s endpoint analysis, ensuring a computer is a Government Asset, has virus software and even encryption software is no guarantee that they will not have some sort of malware. Cyveillance.com states that AV Vendors detect, on average, less than 19% of malware attacks. 0-day malware will almost certainly go undetected on your government issued workstation if it gets on there and the VPN Tunnel becomes a definite INFOSEC concern. This is another good reason to use ICA as it differs in many ways from VPN outside of its lower bandwidth usage.
The ICA Protocol sends screen refreshes over the wire on port 1494 or port 2598. Using the FIPS Compliant AGEE MPX 9700 series you can drastically reduce your attack surface by forcing SSL to the appliance and only allowing ICA protocols to traverse the network. This means no information ever leaves the internal network, only screen refreshes. Agencies can use Smart Access policies to determine whether or not users can print, save data locally or paste text onto their own systems. This, in effect, creates a secure kiosk that keeps data from leaving the network unless it is explicitly allowed. Is there still a role for VPN?, absolutely, for Sys Admins, Network and INFOSEC staff, there will always be a need for VPN but for the general mass populous, Citrix with ICA can deliver a full desktop and run applications on the switched network providing considerably higher level of security along with better overall performance. .
NOTE: During the snow event our Netscaler 9700 MPX had over 5000 connections on it and the impact on the CPU and memory was less than 5%. The device is new and I believe this is the first real test of the FIPS multicore models that Citrix Netcaler has. I would say this is a pretty stout machine!
Support:
Okay, so you have your secure Remote Access Solution, now you have to figure out how to support it. At my agency, the “Remote Access” campus is the 2nd largest at nearly 4000 users a day and over 10,000 users a month. Most campuses have at least 5-10 level II engineers supporting desktop related issues as well as general user questions. Most Citrix teams are made up of 3-6 engineers that I have seen so this begs the question. Can you support 10,000 users with 3-6 Engineers and still get anything done? Keeping your Level III staff out of the Desktop support business is going to take some careful planning and I think is a step that is often overlooked in the VDI/Virtualization realm. For starters, most of my colleagues have not been Desktop Technicians for 7-10 years. We needed a way to ensure that the end users could continue to call the Service Desk as they always have and get the help they need and avoid introducing a “blind spot” into our support strategy. One of my “Soapbox” issues with VDI deployments is the lack of consideration given to Desktop support during the implementation. I often wonder if the fact that VDI is so dominated by Architects and Engineers without being sold to the Desktop staff is the reason it has not skyrocketed after being called the next big thing by Gartner and other IT Pundits. Architects’, Engineers and Sys Admins may not be the only relevant audience in the VDI discussion, in fact, it may be possible that they are not even the MOST relevant audience in the discussion.
(Stop ranting and move on John). Okay for our deployment we realized that first, the users were remote so there WAS no desktop support person to come help them and two, we needed a better and more skilled Level One Service Desk to be able to support the influx of remote users. We engaged in what was, at the time, a unique training regimen for the Service Desk staff. Basically, a remote user who cannot get connected by the person who answers the phone, won’t be able to work or the call will get escalated to your Level III engineers. This will cause considerable dissatisfaction with the end users as well as Engineers who get overwhelmed with escalations. We have a 90% first call resolution rate as a result of extensive training of our call center. Further, the rate at which the end user can be helped by the first person they talk to on the phone is going to be directly proportional to the success of your remote access endeavor. Our training focused on a number of routine tasks, client installation, routine connectivity issues and credential related issues (reset paswords, etc) but it also focused on what the common calls were. To accomplish this we integrated business intelligence (SSRS) to provide a visual representation of our Service Desk call data. Keep in mind, regardless of how talented your team is and how well engineered your solution is, the people answering the phone are the “Virtual face” of your system and they need to believe in it just as much as you do.
Monitoring the Level one calls concerning Citrix was a huge step in the QA of our system and was another major reason for our growth. By monitoring our calls we were able to build out focused training strategies as well as provide ourselves with situational awareness of our system. What we noticed was that 1-2 percent of all users would call the service desk with any number of standard issues regardless of how stable the system was. That means that if you suddenly have 1500 teleworkers each day, you will receive an additional 15-30 service desk calls that day. Keep this in mind as some call centers are already staffed pretty lean. 30 calls a day is likely another body’s worth of work. Other benefits of monitoring our level one calls was to check after a change to make sure we did not see a spike in calls. The basic rule was to assign a “Pit Boss” each day to monitor our Call dashboard and ensure that everything is running smooth. The standard rule is to look at a call and ask yourself “could we make a system change to prevent this call?” If yes, than take it into consideration and if not then don’t worry about it. As I said, 1-2% would always call no matter what (passwords, User Errors, etc). By monitoring the calls we were able to grow by over 50% over the next two years while reducing our call volume by nearly the same number.
Other important tools we use are Edgesight to look at historical data concerning a users Latency and which systems they logged into, GotoAssist so that the users could support end users out in the field in the same manner as a Desktop technician. Several Custom Powershell scripts to get key metrics from XenAPP and SQL Server Reporting Services, part of Edgesight, to create custom dashboards and integrate other data sources to provide a holistic vision of the entire environment.
Conclusion:
There are telework think tanks and pundits all over the internet right now. I know the amount of information right now is pretty overwhelming. I am trying to supplement some of that information with some real-world experience of moving from a fledgling Citrix farm to the 2nd largest campus at a large federal agency. As I stated, treat your telework environment as a campus. Find out what support your population has at the desktop and make sure you can get as close to that as possible remotely. Again, the person answering the phone HAS to be able to get them back online or things will go downhill from there. Watch your support calls and take an active interest in your systems impact on your call centers and service desk. Work with them and sell them on the system and be supportive of their concerns. Right now, if we make a mistake, there will be 100 calls to the service desk in less than 30 minutes. Understand the impact of 100 service desk calls in 30 minutes and understand that when Remote Access is down, a whole campus is down.
Thanks for reading.
John
Extending the Rudder
The challenges and benefits
of mobile devices in the enterprise.
The last 18 months has witnessed a barrage of smart phones and tablets coming onto the market. While these devices score high marks for being “cool” I can honestly say, the INFOSEC pessimist in me says “Malware Vector” and the enterprise solutions person in me says I can put enterprise applications in the hands of key C-Level decision makers regardless of where they are. If deployed securely, mobile devices and smart phones could be the culminating of business agility we have all been working toward for years.
Unfortunately, information security groups are rubbing their temples in the wake of a recent, and rather embarrassing, security breach with Apple’s iPAD product. A few weeks ago I bought a Chinese knock-off android tablet, after receiving it I connected it to my wireless network, brought up my Syslog server to watch PIX logs and within ten minutes, it was phoning home to a site in Japan! (I knew it!) We have also had stories of some of these smart phones being shipped with malware before they are ever handed to the end users.
In many organizations, prior to connecting to your network remotely, you are forced to undergo rigorous endpoint analysis to ensure that you have a proper and updated virus signature, a host based firewall, an approved build, encryption software, etc. Many INFOSEC groups kicked and fought for these policies in what has been described to me by my colleagues as just short of a bloodbath. For some IT shops, the blood of the remote access policy fight hasn’t even dried yet and if smart phone vendors think that enterprises will abandoned these polices to accommodate these devices they are delusional. At the same time, securing a smart phone may strip it down to the point that it is really no more valuable than the cell phone they have today.
I read the other day that Juniper is making a VPN client for Smart Phones. While I agree that Juniper VPN is a good product, I think it is risky to grant a VPN tunnel to any of these appliances. Why would a PC have to pass an endpoint scan and a smart phone not? Are they going to build smart phone endpoint scanners/agents?
John, if you are so down on smart phones, why do you want to support them?
In our world, the end users do not exist because of us, we exist because of them. The title of this blog post was called “Extending the Rudder” and what I mean by that is that key decision makers in a company cannot be given too much agility. I am quite certain that Larry Ellison is not the CEO of oracle because he is the world’s best DBA. He is in that position because of his ability to steer the company and make critical decisions. Decisions are made through key metrics that are delivered to them via briefings, emails, etc. There is never too many ways to make this information available so long as you can keep it secure.
The mobile platform introduces the ability to take business agility to the next level and effectively “extend the rudder” to C-level and/or key decision makers in any organization. This goes beyond helping them look cool on the golf course. Products like SoftwareFX can deliver business intelligence reporting that is custom fit for a particular smart phone or device. The ability to deliver key metrics or enterprise applications to mobile users will make your organization more nimble AND look cool on the golf course.
Security Breaches:
There was a great article this week from Enterprise Mobile Today on the challenges of supporting mobile devices. It also included a discussion on the security breach that occurred with Apple’s iPAD stating “Although the Valley Wag, the online publication that broke the story, implied that the breach was Apples responsibility, the issue was due to AT&T’s systems.”
Guess what, if there is a breach of corporate information on an iPAD issued by your company or agency, or you granted access to enterprise applications to an personally owned iPAD, it’s your responsibility. While Apple has restricted the use of middleware on its iPhone/iPAD applications, the other smart phone vendors may not. At issue here is the willingness to open up the OS on these devices to middleware while at the same time protecting the user and themselves from breaches. I know that Apple has taken a lot of flak for its policies on middleware and there is a big push to get them to back off on it. Either way, so long as these moving parts exists, there is a possible vector for malware, breaches and all around jackassery. There have also been concerns about the security of the Safari browser and opening up your ERP to a mobile device could mean exposing your infrastructure to an OS that currently has no enterprise virus scanning software and, in some cases, has applications installed on it that may carry malware themselves.
So how does thin computing get around this?
While I expect a lot of INFOSEC and IT Departments are going to say “No” when it comes to permitting the use of smart phones. I believe through thin computing via Citrix receiver and XenAPP or XenDesktop you can easily deliver safe and secure enterprise applications that will not run on the smart phone at all but rather on a locked down XenAPP Server or XenDesktop environment that only sends screen refreshes instead of full session traffic that can be sniffed or interpreted by a bot or malware.
Also noted in the article on Enterprise Mobile Today was the fact that several thousand email addresses were stolen as were some of their contact lists, including those of some high level government officials. Citrix has introduced an email client that has been optimized for mobile users. I highly recommend that you look at the session here: http://www.citrix.com/tv/#videos/2385
I think this product is fantastic and shows how organizations are going to have to ready themselves to securely deliver enterprise applications to mobile devices. In this scenario, the users email contacts and personally identifiable information exist on the exchange server and on the XenApp client that is run out of an ICA session. If the phone is lost, stolen, damaged or hacked, the information available on it is of no use as the crown jewels remain safe on the enterprises servers. Two factor authentication that is supported by the Citrix receiver and regular password reset regimen will help secure the end users credentials. All of these factors will allow systems administrators and INFOSEC types to have the freedom to innovate with this new technology.
The drawing below is an example of a VPN tunnel into an internal Network. In most cases, VPN appliances are installed with an “any any” rule allowing the clients to connect anywhere in the organization once the log in.

In this drawing we see how using the Citrix receiver is not a full VPN tunnel but an ICA Session that sends encrypted pixel refreshes to the end user instead of raw data. This means that if there is a zeus bot, or the like, on the phone looking for key html or xml such as “password” or “Card Number” it will not appear because the only data coming across is screen refreshes. This effectively keeps the data running on a restricted environment via XenAPP or XenDesktop.

Conclusion:
It appears as though the next technological line in the sand will be these mobile devices. The coming battle for superiority in this space will likely involve small OSes such as the Mac BSD hybrid OS and the Linux hybrid(s) that is on a lot of the ‘Droid series phones. These are very streamlined distro’s that you will not simply be able to install a complex anti-virus suit like McAfee or Symantec. Also, I believe that the prevalence of these devices will only grow and they are upon us as Sys Admins whether we like it or not. As Citrix is basically present in nearly every large company, Citrix receiver, coupled with Access Gateway and SoftwareFX could put you and your team in a position to be able to accommodate this level of agility. Ensure that your INFOSEC teams understand the difference between an ICA Session and a VPN Tunnel, begin to educate decision makers on why we can make use of this technology for end users who are in the field and need this level of agility. Put yourself in a position to say yes, as it doesn’t take a great deal of innovation to say “no”.
God knows, I am hardly the gadget enthusiast, in fact I remember telling people that a phone was for talking on and nothing more but this new breed of smart phone and affordable tablets has me excited to see what we can do for our users in the field who, ultimately, pay all of our salaries.
Thanks for reading.
John
