ICASTART, ICAEND “ICA-LIKE!!!”
In 2008 I had a conversation with Jay Tomlin asking him if he would put in an enhancement for ICA Logging on the AGEE. Basically we wanted the ability to see the external IP Addresses of our customers coming through the Access Gateway. As you are likely aware, what you get in the logs are the IP Addresses bound to the workstation and not the external IP Address that they are coming through. In the last ten years, it has become increasingly rare for an end user to actually plug their computer directly into the internet and more often, they are proxied behind a Netgear, Cisco/Linksys, and Buffalo switch. This makes reporting on where the users are coming from somewhat challenging.
Somewhere between 9.2 and 9.3 the requested enhancement was added and it included other very nice metrics as well. The two syslog events I want to talk about are ICASTART and ICAEND.
ICASTART:
The ICASTART event contains some good information in addition to the external IP. Below you see a sample of the ICASTART log.
12/09/2012:14:40:46 GMT ns 0-PPE-0 : SSLVPN ICASTART 540963 0 : Source 192.168.1.98:62362 – Destination 192.168.1.82:2598 – username:domainname mhayes:Xentrifuge – applicationName Desktop – startTime “12/09/2012:14:40:46 GMT” – connectionId 81d1
As you can see, if you are a log monger, this is a VERY nice log!! (Few can appreciate this) With the exception of the credentials everything is very easy to parse and place into those nice SQL Columns I like. If you have Splunk, parsing is even easier and you don’t have to worry about how the columns line up.
ICAEND:
The ICAEND even actually has quite a bit more information and were it not for the need to report ICA Sessions in real time, this is the only log you will need. Below is the ICAEND log.
12/09/2012:14:41:12 GMT ns 0-PPE-0 : SSLVPN ICAEND_CONNSTAT 541032 0 : Source 192.168.1.98:62362 – Destination 192.168.1.82:2598 – username:domainname mhayes:Xentrifuge – startTime “12/09/2012:14:40:46 GMT” – endTime “12/09/2012:14:41:12 GMT” – Duration 00:00:26 – Total_bytes_send 9363 – Total_bytes_recv 587588 – Total_compressedbytes_send 0 – Total_compressedbytes_recv 0 – Compression_ratio_send 0.00% – Compression_ratio_recv 0.00% – connectionId 81d16
Again, another gorgeous log that is very easy to parse and put into some useful information.
Logging the Data:
So, this was going to be my inaugural Splunk blog but I didn’t get off my ass and so my eval of Splunk expired and I have to wait 30 days to use it again (file that under “phuck”). So today we will be going over logging the data with the standard KIWI/SQL (basically a poor man’s Splunk) method.
So the way we log the data, if you haven’t been doing this already, is we configure the Netscaler to send logs to the KIWI Syslog server and we use the custom data source within KIWI to configure a SQL Logging rule. We then create the table, parse the data with a parsing script and voila, instant business intelligence.
Creating the custom KIWI Rule:
First, create the rule “ICA-START/END” with a descriptive filter configured as you see below.

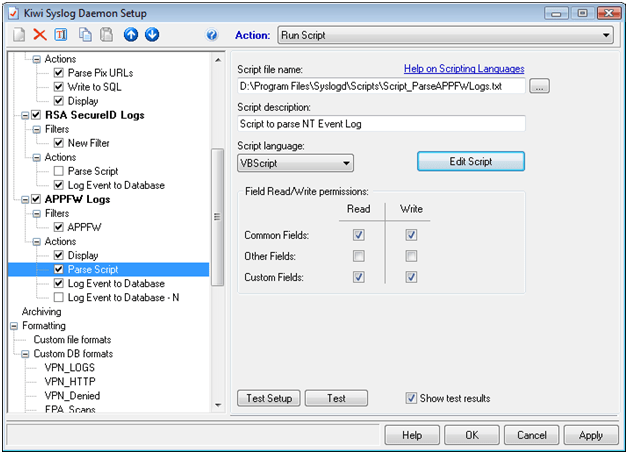
Next you will optionally configure a Display action but more importantly you will configure the Script that parses the data.

Paste the following text (Below) into a file named Script_Parse_AGEE-ICA.txt and save it in the scripts directory of your KIWI install.
Function Main()
Main = “OK”
Dim MyMsg
Dim UserName
Dim Application
Dim SourceIP
Dim DestinationIP
Dim StartTime
Dim EndTime
Dim Duration
Dim SentBytes
Dim RecBytes
Dim ConnectionID
With Fields
UserName = “”
Application = “”
SourceIP = “”
DestinationIP = “”
StartTime = “”
EndTime = “”
Duration = “”
SentBytes = “”
RecBytes = “”
ConnectionID = “”
MyMsg = .VarCleanMessageText
If ( Instr( MyMsg, “ICAEND_CONNSTAT” ) ) Then
SrcBeg = Instr( MyMsg, “Source”) + 6
SrcEnd = Instr( SrcBeg, MyMsg, “:”)
SourceIP = Mid( MyMsg, SrcBeg, SrcEnd – SrcBeg)
DstBeg = Instr( MyMsg, “Destination”) + 11
DstEnd = Instr( DstBeg, MyMsg, “:”)
DestinationIP = Mid( MyMsg, DstBeg, DstEnd – DstBeg)
UserBeg = Instr( MyMsg, “domainname”) + 10
UserEnd = Instr( UserBeg, MyMsg, “-“)
UserName = Mid( MyMsg, UserBeg, UserEnd – UserBeg)
StartBeg = Instr( MyMsg, “startTime “) + 11
StartEnd = Instr( StartBeg, MyMsg, ” “)
StartTime = Mid( MyMsg, StartBeg, StartEnd – StartBeg)
EndBeg = Instr( MyMsg, “endTime “) + 9
EndEnd = Instr( EndBeg, MyMsg, ” “)
EndTime = Mid( MyMsg, EndBeg, EndEnd – EndBeg)
DurBeg = Instr( MyMsg, “Duration “) + 9
DurEnd = Instr( DurBeg, MyMsg, ” “)
Duration = Mid( MyMsg, DurBeg, DurEnd – DurBeg)
SentBeg = Instr( MyMsg, “Total_bytes_send “) + 17
SentEnd = Instr( SentBeg, MyMsg, ” “)
SentBytes = Mid( MyMsg, SentBeg, SentEnd – SentBeg)
RecBeg = Instr( MyMsg, “Total_bytes_recv “) + 17
RecEnd = Instr( RecBeg, MyMsg, ” “)
RecBytes = Mid( MyMsg, RecBeg, RecEnd – RecBeg)
ConBeg = Instr( MyMsg, “connectionId”) +12
ConnectionID = Mid( MyMsg, ConBeg)
Application = “NA”
end if
If ( Instr( MyMsg, “ICASTART” ) ) Then
SrcBeg = Instr( MyMsg, “Source”) + 6
SrcEnd = Instr( SrcBeg, MyMsg, “:”)
SourceIP = Mid( MyMsg, SrcBeg, SrcEnd – SrcBeg)
DstBeg = Instr( MyMsg, “Destination”) + 11
DstEnd = Instr( DstBeg, MyMsg, “:”)
DestinationIP = Mid( MyMsg, DstBeg, DstEnd – DstBeg)
UserBeg = Instr( MyMsg, “domainname”) + 10
UserEnd = Instr( UserBeg, MyMsg, “-“)
UserName = Mid( MyMsg, UserBeg, UserEnd – UserBeg)
AppBeg = Instr( MyMsg, “applicationName”) + 15
AppEnd = Instr( AppBeg, MyMsg, “-“)
Application = Mid( MyMsg, AppBeg, AppEnd – AppBeg)
StartBeg = Instr( MyMsg, “startTime “) + 11
StartEnd = Instr( StartBeg, MyMsg, ” “)
StartTime = Mid( MyMsg, StartBeg, StartEnd – StartBeg)
ConBeg = Instr( MyMsg, “connectionId”) +12
ConnectionID = Mid( MyMsg, ConBeg)
EndTime = “NA”
Duration = “NA”
SentByes = “NA”
RecBytes = “NA”
end if
.VarCustom01 = UserName
.VarCustom02 = Application
.VarCustom03 = SourceIP
.VarCustom04 = DestinationIP
.VarCustom05 = StartTime
.VarCustom06 = EndTime
.VarCustom07 = Duration
.VarCustom08 = SentBytes
.VarCustom09 = RecBytes
.VarCustom10 = ConnectionID
End With
End Function
Next you will create the custom DB format exactly as follows:
(IMPORTANT: NOT SHOWN Make sure you check “MsgDateTime” in this dialog box near the top)

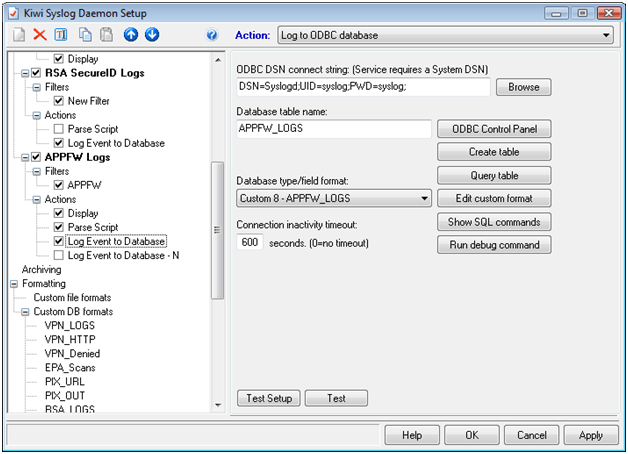
Then you will create a new “Action” called “Log to SQL” and select the Custom DB Format and name the table AGEE_ICA and select “Create Table”. If you have not yet, build your connect string by clicking the box with the three periods at the top “…”

Then watch for ICASTART and ICAEND instances.

Then look at the data in your SQL Server:

Now you can report in real-time on external utilization by the following:
- Utilization by IP Range
- Utilization by Domain
- Utilization by UserID
- Utilization by time of day
- Average Session Duration
- You can tell if someone worked or not (“Yeah, I was on Citrix from 9AM to 5PM”)
Most of the queries you can reverse engineer from Edgesight Under the hood but if there is a specific query you are after just email me.
I get the average session duration with the following query:
select
avg(datepart(mi,cast([duration] as datetime)))
from syslog.dbo.agee_ica
where duration <> ‘NA’
I tried to put everything in one table as you can see from the SQL Data Columns and the parsing script but you can split it up into separate tables if you want.
Thanks for reading!
John
Doing it Cheap, and Right, with Kiwi Syslog Server, SQL and Netscaler Application Firewall
Last week I noted an interesting blog from the guys at Splunk who have developed a way to parse and display Application Firewall blocks and place them into a nice dashboard. Splunk has been doing some interesting stuff here in the last 12 months or so that Citrix Administrators should take note of, especially if they are feeling the pain of real-time monitoring in their Citrix Environment. First off, they hired/contracted Brandon Shell and Jason Conger to work with them. I can tell you that over the years I have had my share of monitoring “tools” shoved down my throat and the majority of them were NETWORKING tools built by NETWORKING companies to support NETWORKING professionals who then tried to retrofit the product to monitor servers.
The Citrix environment alone has its own quarks when it comes to monitoring had having Brandon and Jason on the Splunk team will pretty much ensure that they will build the absolute most relevant monitoring tool out there for supporting Citrix enterprises. While this is not meant to be a glowing endorsement of Splunk it is an endorsement of the two professionals they have hired to build out their Citrix vision.
This article is to cover how I am doing SOME of what splunk is doing at a fraction (almost free) of the cost that you would spend on monitoring products, including splunk. In the last few years I have posted collecting and logging Netscaler syslogs to SQL Server for the purpose of dashboarding VPN Utilization, Endpoint Analysis Scan Results as well as logging Pix Logs to SQL Server via KIWI as well. In this post, I will show you some of what I have been doing for the last few years with my APP Firewall Logs by putting them into KIWI and then writing them to a SQL Server.
Setting up KIWI:
- Set up a Filter for KIWI to catch the APP Firewall Logs:

2. Use this Parsing Script
Function Main()
Main = “OK”
Dim MyMsg
Dim Offense
Dim Action
Dim Source
With Fields
Offense = “”
Action = “”
Source = “”
MyMsg = .VarCleanMessageText
If ( Instr( MyMsg, “APPFW” ) ) Then
OffenseBeg = Instr( MyMsg, “APPFW”) + 6
OffenseEnd = Instr( OffenseBeg, MyMsg, ” “)
Offense = Mid( MyMsg, OffenseBeg, OffenseEnd – OffenseBeg)
end if
If ( Instr( MyMsg, “<blocked>” ) ) Then
Action = “BLOCKED”
End If
If ( Instr( MyMsg, “<not blocked>” ) ) Then
Action = “NOT BLOCKED”
End If
If ( Instr( MyMsg, “<transformed>” ) ) Then
Action = “TRANSFORMED”
End If
If ( Instr( MyMsg, “.” ) ) Then
SourceBeg = Instr( MyMsg, “: “) +3
SourceEnd = Instr( SourceBeg, MyMsg, ” “)
Source = Mid( MyMsg, SourceBeg, SourceEnd – SourceBeg)
End If
.VarCustom01 = Offense
.VarCustom02 = Action
.VarCustom03 = Source
End With
End Function
Set up Custom Data Connectors:

Configure database connection and create the table:
Once you have created the table you should start to see some data come in as the App Firewall blocks IP’s. I used the free version of Netsparker to generate some blocks and ran the following query and got the results below:

While it is not totally visible, the “MsgText” column includes the entire log, this may be necessary as forensic evidence as some jurisdictions require the entire log, unparsed, for evidence.
So John, why SQL and not just Splunk?
I have heard folks say that Splunk is expensive, and it might be but in the realm of monitoring tools I believe it is likely less expensive than most others. For me I needed the data to be portable so that I could cross reference it with different tables. In my case, I usually reference my sources with a GEO-Spatial table as well as with a Malware Blacklist. If you are in the DMZ currently, it is not a bad idea to collect INTEL on who is performing recon scans or probes against your systems. Having the data in a SQL Server allows me to set up stored procedures that will alert me if specific metrics are met. Also, a preponderance of malfeasance can be escalated to your INFOSEC team and you can be much more proactive in blocking hosts. Below is a query I run that references the GEOIP table that I have. I changed my IP Address to an IP Address from China to show how you can cross reference the data.

You can see where a large number of blocks have come from China (well, not really) and this is something you may want to escalate. Usually, hackers are not dumb enough to try something like this. My experience is that you will need to look for things like a consistent delta between probes, that kind of stuff. At any rate, without portability, this would be tough to do with a flat file database although I do believe Splunk has an API that could ease some of this.
Conclusion:
Data portability, for me, is the plumb here, this goes beyond making a pretty graph and moves forward into the long term battle against OWASP top ten in that you can gather INTEL and position yourself to know which IP’s are risky and which IP’s just have some bot or malware on them. Ultimately, if you are not a “SQL-phile” or a programming hack like me this may not be the best option. Folks like Sam Jacobs are a great resource as he is another guy who is very adept at getting Syslogs into SQL. I expect with the additions of Conger and Shell you will see great things come out of Splunk for monitoring Citrix environments. There are a number of new and cool things that they are doing that I need to “get hip” to. If you are struggling with your budget and have some basic SQL Skills, this may be a great option for you to get similar metrics and reporting that you can get with Splunk for a fraction of the price.
I apologize for the delay in posts, I plan on getting at least one post a month up for both xen-trifuge and Edgesight under the Hood.
Take care
John
Project Poindexter:VPN Logs
Total Information Awareness with your Netscaler/AGEE
Harvesting VPN Logs with the Netscaler:
When I first heard about Total Information Awareness I was a little concerned. Like a lot of my current team, I am one of those libertarians who really isn’t keen on his personal life being correlated and analyzed and a program that is overseen by unelected officials. That said, as an individual responsible for the security and integrity of information systems as well as a person who’s own personally identifiable information is in the databases of my bank, doctor and employer, I do believe I am entitled to know what is going on and I would like to think the stewards of my information are also informed of what is going on with regards to my own data. For this reason, I decided to start looking into how I could better monitor activity on my Netscaler and I wanted to provide an accompanying guide to my SCIFNET post/video showing how you can compartmentalize sensitive data using the VPX or a regular MPX class Netscaler.
Most engineers are fully aware that the Netscaler platform is capable of sending information to a syslog server. This in and of itself is not that significant as many network/Unix based appliances can syslog. What I want to discuss in this post is how to use a very cheap syslog server to set up a fully functional log consolidation system that includes parsing specific records and writing them to a relational database.
I find a certain amount of frustration with today’s six figure price tag event correlation systems and if you can only respond to a breach by doing “Find and Next” on a 90GB ASCII file, needless to say, that is not the most agile way to respond and not where it needs to be to react to an INFOSEC related incident. As with the Admiral Poindexter’s vision, proper analysis of events can be an instrumental tool in the defense of your information systems.
Below is an example of a typical VPN log from your Netscaler/AGEE appliance:
06/15/2010:05:59:38 ns PPE-0 : SSLVPN HTTPREQUEST 94167 : Context wireless@192.168.1.50 – SessionId: 5- http://www.veoh.com User wireless : Group(s) SCIF-NET USERS : Vserver 192.168.1.100:443 – 06/15/2010:05:59:38 GET /service/getUpdate.xml?clientGUID=01BACADF-CE85-48CD-8270-B8A183C27464&VEOH_GUIDE_AUTH=am1zYXpib3k6MTI3ODAyODkyMTM1NzpyZWdp – –
Using KIWI Syslog server’s parsing capability, I will actually parse this data and write it into a SQL Server database to allow for very easy queries and eventually dashboards showing accountability and key data.
I have had engineers ask me how to get things like Client IP Address and what they have accessed. I will provide a parsing script that will pull from the example above, the following: (As in the case of the log above)
Context: wireless@192.168.1.50
Destination: http://www.veoh.com
Payload: GET /service/getUpdate.xml?clientGUID=01BACADF-CE85-48CD-8270
*I have also included “Assigned_IP” in case any of you assign ip addresses instead of NATing. If you are able to get the Destination of where a user was going, the need to account for every IP Address may become less important but some folks insist on not NATing their users. If so, the parse script will grab their IP’s as well.
And just to show you that I do have the data you can see in the screen print below of the SQL Query:
Uh, John…who cares?
Well, most of the time you really shouldn’t need to do a lot of tracking of where your users are going but in some higher security environments being able to account for where users have gone could be very important. Say you hosted http://www.veoh.com (a site I hate but for the purpose of this lab, their malware…err…client was installed on the laptop I was testing with) and someone said that the system had been compromised. You could immediately obtain every user ID and IP Address that accessed that site and what the payload that they ran against it was. You would see the XSS or SQL Injection string immediately. You would also note a system that had malware and was trying to get in over one of the SMB “Whipping boys” (445, 135-139).
Parsing data vs. just throwing it all into a flat file and waiting for an auditor to ask for it?
As I stated previously, the ability to have your data in a relational database can give you a number of advantages, not just pretty tables and eventually dashboards but you also open the door to the following:
- Geospatial analysis of incoming IP Addresses (by cross referencing context with geospatial data from iptolocation.com or other free geospatial ip-to-location data.
- An actual count of the number of concurrent users on a system within a block of time including historical reporting and trending.
- The number of times a “Deny” policy has been tripped and who tripped it. If you are compartmentalizing your data and you want to know who tried to access something they are not allowed to.
- Your sensitive data is on wiki leaks and you want to know every user who accessed the resource the data resides on, when and what ports they used?
- And lastly, find out who is going ” \\webserver\c$” to your web server instead of “http://webserver”
So what do I log?
Well, I log basically everything but for VPN I log three different events into two different tables, I log all HTTP based traffic, normal UDP/TCP based connections and I also have a separate table for all of my “DENIED_BY_POLICY” Events.
Here is an example of an HTTPREQUEST log:
06/15/2010:11:59:58 ns PPE-0 : SSLVPN HTTPREQUEST 110352 : Context wireless@192.168.1.50 – SessionId: 5- http://www.veoh.com User wireless : Group(s) SCIF-NET USERS : Vserver 192.168.1.100:443 – 06/15/2010:11:59:58 GET /service/getUpdate.xml?clientGUID=01BACADF-CE85-48CD-8270-B8A183C27464&VEOH_GUIDE_AUTH=am1zYXpib3k6MTI3ODAyODkyMTM1NzpyZWdp – –
Here is an example of TCP/UDPFlow statistics:
06/15/2010:12:18:16 ns PPE-0 : SSLVPN UDPFLOWSTAT 111065 : Context wireless@192.168.1.50 – SessionId: 5- User wireless – Client_ip 192.168.1.50 – Nat_ip 192.168.1.85 – Vserver 192.168.1.100:443 – Source 127.100.0.5:53052 – Destination 239.255.255.250:1900 – Start_time “06/15/2010:12:15:32 ” – End_time “06/15/2010:12:18:16 ” – Duration 00:02:44 – Total_bytes_send 1729 – Total_bytes_recv 0 – Access Allowed – Group(s) “SCIF-NET USERS”
Here is an example of a DENIED_BY_POLICY event: (Over HTTP)
06/15/2010:10:17:14 ns PPE-0 : SSLVPN HTTP_RESOURCEACCESS_DENIED 106151 : Context wireless@192.168.1.50 – SessionId: 5- User wireless – Vserver 192.168.1.100:443 – Total_bytes_send 420 – Remote_host pt.veoh.com – Denied_url POST /tracker/update.jsp – Denied_by_policy “Problem-Site” – Group(s) “SCIF-NET USERS”
Let’s talk a little about the “DENIED_BY_POLICY” logs
Here is a Scenario: I have a problem website that I do not want any of my users to go to so I create a policy called “Problem-Site” denying access to the IP of the problem site.
For the log above, I parse the following:
Context: wireless@192.168.1.50
Destination: pt.veoh.com
Policy: Problem-Site
Payload: POST /tracker/update.jsp
I also log non-http denies as well, these appear like the following:
06/14/2010:21:08:03 ns PPE-0 : SSLVPN NONHTTP_RESOURCEACCESS_DENIED 69761 : Context wireless@192.168.1.50 – SessionId: 5- User wireless – Client_ip 192.168.1.50 – Nat_ip “Mapped Ip” – Vserver 192.168.1.100:443 – Source 192.168.1.50:50343 – Destination 10.10.10.30:139 – Total_bytes_send 291 – Total_bytes_recv 0 – Denied_by_policy “TOP-SECRET-DENY” – Group(s) “SCIF-NET USERS”
Here is a Scenario: You read a story in “wired.com” about some kid who tried to give a bunch of sensitive data to a hacker or even wiki leaks and you are concerned about your own data being accessed without authorization. You want to monitor all attempts to get unauthorized access and you want to note them, or, since they are in SQL Server w/reporting services, create a dashboard that goes RED when a particular policy is tripped.
Another scenario would be to actually monitor successes and note the “Context”, if most users who access data provided by the “TOP-SECRET-ALLOW” policy come from a specific network ID, say 10.105.28.0/24 and you start seeing access from 10.111.13.68 then you can see if a user ID has been compromised, you can also query and see how often a user accesses data from which IP Addresses. If someone’s account is compromised, it would show up as coming from another IP as it is less likely that they are sitting at the user’s terminal.
In the log above I parse the following:
Context: wireless@192.168.1.50
Destination: 10.10.10.30:139 (note the :139 indicating an attempt to use SMB)
Policy: TOP-SECRET-DENY
Payload: (Blank if not HTTP)
Below is an example of Reporting Services dashboard that refreshes every minute:(Note, I have a particular Policy that turns red in this dashboard to alert me of an important breach attempt)
| Time | Appliance | Context | Destination | Policy | Payload |
| 12:37 | 192.168.1.75 | wireless@192.168.1.50 | 10.10.10.30 :3389 | TOP-SECRET-DENY | |
| 12:37 | 192.168.1.75 | wireless@192.168.1.50 | 10.10.10.30 :3389 | TOP-SECRET-DENY | |
| 12:37 | 192.168.1.75 | wireless@192.168.1.50 | 10.10.10.30:3389 | TOP-SECRET-DENY | |
| 12:37 | 192.168.1.75 | wireless@192.168.1.50 | 10.10.10.30:3389 | TOP-SECRET-DENY | |
| 12:37 | 192.168.1.75 | wireless@192.168.1.50 | pt.veoh.com | Problem-Site | POST /tracker/update.jsp |
| 12:37 | 192.168.1.75 | wireless@192.168.1.50 | 10.10.10.30:139 | TOP-SECRET-DENY |
What You need:
- You need an incumbent SQL Server Environment, you need Reporting Services if you want dashboards (If you have edgesight you should already have this)
- You need to be able to set up an ODBC Connection, remember if it is a 64-bit server/workstation you need to use the ODBC tool in %Systemroot%\sysWOW64
- You need to be able to set up a database connection in Reporting Services
- $245 bucks for a full version of KIWI, if you buy a Netscaler you can afford a full version of KIWI, I will cover several solutions that will make this the best $245 you have ever spent.
How to set it up:
Once you brow beat your cheap boss into spending the $245 on KIWI you perform the following steps:
Go to http://www.ctxsupport.com/forums/showthread.php?36-Parsing-Scripts-for-VPN-Data-Mining-on-AGEE and download all of the files. (Follow the instructions in the post)
Create a Database called Syslog with a username and password that has DBO privileges and create an ODBC Data Source on the server hosting KIWI for the syslog database and name it syslogd.
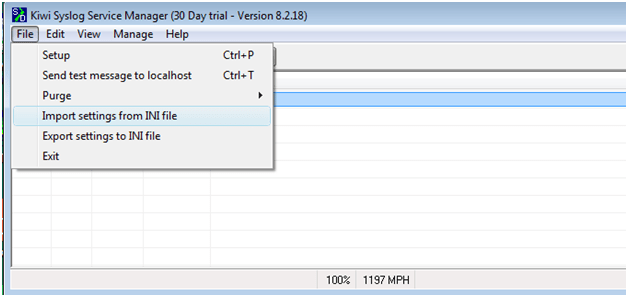
After renaming Netscaler.txt to Netscaler.ini go to KIWI and import the ini file.
On each rule, go to the “Write to SQL” Action and click “Create Table”

On each rule, go to the “Parse Data” Action and click “Browse” to upload the parsing script that goes with each rule. (Check all checkboxes under “Read and Write”
Conlcusion:
Once this is done you will be able to collect a ton of information that is very useful and it beats the hell out of a 90GB ASCII file or just writing everything into a single event correlation system without the ability to query on certain columns. All of the parsing scripts write the entire log to the msgtext column so you still have the original log if there is every any questions. Being able to parse key information in a specific column will give you a considerably higher level of agility when searching for information about a particular user, IP Address, destination or Security Policy.
If there is a worm that is sending a particular payload over http, you are one query away from finding out every infected IP Address. If an auditor asks you how many users have accessed a sensitive server you are a query away from providing that information. I will supplement this post with a video of the entire setup from start to finish on citrix.utipu.com within the next two weeks (Hopefullly).
Also, I tried this in a home based lab (I cannot use my logs from work) so please, if you have any issues getting it to work, let me know so I can set up better instructions. And keep in mind, I have not looked at this with ICAPROXY logs, I am hoping to do that ASAP, there may be a supplement to this that includes a different script and maybe a different table for ICAPROXY logs. I am waiting on an enhancement request before I tackle ICAProxy logs (They will come across as “SSLVPN” but the log does look different than standard VPN logs).
And most importantly, I am not a Developer, I am a poor-man’s DBA and am a marginal scripter at best, if you can write a better parsing script please let me know!!
Thanks for reading
John Smith
